Beyond Top-Line Averages: The Multi-Speed Rubber Market
Managing raw material volatility in the global rubber sector requires looking far deeper than top-line, aggregated index movements. For procurement leaders and supply chain managers overseeing complex natural and synthetic portfolios, single-line benchmark averages fail to reflect the severe pricing fragmentation occurring on the ground across primary manufacturing hubs. When category strategies rely solely on global composite pricing, procurement teams risk missing localized margin pressures that disrupt operational budgets.
Data captured through Grand View Signal highlights this structural divide. Indian RSS3 natural rubber prices surged by 33.5% year-over-year, escalating from 2,269 USD per ton in August 2025 to 3,028.90 USD per ton in August 2026. Over the exact same timeframe, major international reference benchmarks experienced notable downward corrections or sideways trading. This sharp contrast illustrates how localized supply constraints, upstream petrochemical swings, and sector-specific demand recovery rates are breaking traditional regional price parity.

Navigating this multi-speed environment demands a granular evaluation of three primary market forces that are currently dictating cost structures across downstream manufacturing sectors.
1. Fragmentation Between Domestic and International Natural Rubber Markets
Natural rubber pricing is exhibiting sharp geographic divergence rather than following a unified global trend. Regional prices are increasingly dictated by localized physical availability, domestic procurement mandates, currency movements, labor availability, and import tariff structures.
- Domestic Tightness vs. International Softening: Indian domestic sheet-rubber reference prices have remained consistently firm, driven by tight local tapping availability, weather-related harvest interruptions, and steady procurement schedules from domestic tire giants. Conversely, major international benchmark values, such as Bangkok RSS3 futures, experienced notable declines during late-period trading cycles due to softer regional export demand and sluggish purchasing from traditional Western destinations.
- Fluctuating Import Markets: In primary Asian processing and consumption hubs like China, standard natural rubber quotes exhibited multi-phase volatility. Prices shifted from early-period weakness to a modest mid-month technical recovery, before losing structural momentum toward the end of the month as broader industrial purchasing eased.
- Disciplined, Hand-to-Mouth Sourcing: Across almost every major geographic market, enterprise buyers are maintaining strict, schedule-based procurement tactics rather than committing to forward inventory accumulation. This disciplined hand-to-mouth purchasing approach prevents runaway price rallies but leaves supply chains highly vulnerable to sudden short-term physical shortages.
The real-world financial impact of this geographical split is hitting automotive component and tire manufacturers directly. Leading Indian processors, such as MRF and Apollo Tires, faced severe margin compression as domestic RSS4 sheet prices traded near historic highs above ₹270–280/kg. To protect gross margins against these localized domestic premiums, major compounding operations were forced to explore cheaper imported alternatives, renegotiate long-term supply agreements, or adjust domestic blending formulations where import duty structures permitted.
Furthermore, small-to-midsize rubber molders operating in Southeast Asia found themselves squeezed between rising local freight fees and static finished-goods contracts. Companies unable to quickly pass on raw material premiums experienced immediate cash flow contraction, reinforcing the necessity of flexible, regional sourcing contracts rather than rigid multi-year vendor commitments.
Schedule a free demo of Grand View Signal to get real-time preview of price fluctuations in the Rubber Sector
2. Sharp Mid-Month Price Reversals in Butadiene Rubber (BR)
Synthetic rubber polymers, most notably Butadiene Rubber (BR), registered the most extreme price volatility within the broader elastomeric segment, driven by rapid swings in upstream petrochemical feedstocks.
- Rapid Price Spikes: Following sustained early-period price declines across major manufacturing centers like China, BR spot prices underwent a rapid mid-month reversal. This spike was triggered as processors, compounding facilities, and traders returned to the spot market simultaneously to cover urgent short-term operational requirements.
- Downstream Cost Pressure: The velocity of the BR spot price increase created immediate replacement-cost pressures for tire manufacturers, industrial rubber goods producers, and footwear compounders relying on steady synthetic inputs.
- Late-Month Demand Resistance: Because the mid-month price surge outpaced the speed of recovery in actual end-user consumer demand, buyers firmly resisted accumulating long-term spot positions. As immediate cover purchasing subsided, BR prices moderated from their peak levels, though they settled notably higher overall than at the start of the monthly cycle.
When upstream Butadiene feedstock spikes ripple through synthetic rubber supply contracts, downstream fabricators face immediate margin friction. Automotive parts suppliers and footwear compounders (such as shoe sole manufacturers) struggle to pass sudden raw material cost increases onto powerful original equipment manufacturers (OEMs). To mitigate these unbudgeted price spikes, numerous compounding facilities opted to temporarily pause non-essential production runs during peak spot rallies, refusing to lock in elevated raw material rates.
The broader implication for synthetic rubber buyers is clear: tracking polymer prices alone provides an incomplete picture. Because naphtha steam cracker operating rates and regional co-product dynamics heavily influence Butadiene availability, procurement teams must maintain visibility into upstream refining economics to predict synthetic rubber cost shifts before spot market quotes adjust.
Get historical, current, and forecast rubber price assessments. Request Free Access to Grand View Signal
3. Measured Recovery in Acrylonitrile Butadiene Rubber (NBR)
Acrylonitrile Butadiene Rubber (NBR) demonstrated a distinct, application-led recovery trajectory, diverging significantly from the high-volume, tire-centric movements seen in natural rubber and BR markets.
- Steady Second-Half Price Gains: Following initial early-period price softening, NBR values strengthened consistently during the second half of the month, establishing NBR as one of the most resilient and top-performing commodities in the synthetic category.
- Diversified End-Use Demand: Unlike Butadiene Rubber, which remains heavily tied to global automotive tire production, NBR demand benefited from a highly diversified industrial base. Strong consumption was driven by sectors requiring superior oil-, chemical-, and fuel-resistant properties, including automotive seals, fuel lines, industrial gaskets, printer rollers, cable jacketing, and heavy-duty protective footwear.
- Replenishment-Led Stability: Although industrial buyers maintained cautious inventory strategies amid broader macroeconomic uncertainties, regular, non-discretionary replenishment across industrial maintenance and repair sectors supported firm, stable pricing through month-end.
This stability directly aided specialized component manufacturers. Industrial seal and gasket fabricators supporting the oil and gas, chemical processing, and industrial machinery sectors benefited from predictable, steady end-use demand. Unlike tire producers operating under razor-thin spot margins, specialty NBR fabricators maintained stable operating rates and protected profit margins due to consistent replacement cycles in heavy industry.
In addition, global regulatory pushes emphasizing workforce safety and industrial environmental compliance have boosted demand for high-specification NBR grades. Fabricators producing chemical-resistant protective gear and specialized automotive fuel systems were able to maintain healthier pricing power compared to commodity rubber producers, insulating them from broader industrial slowdowns.
Access commodity-wise monthly forecast datasets for the next 6 months. Request Free Access to Grand View Signal
Strategic Procurement Takeaways for Category Leaders
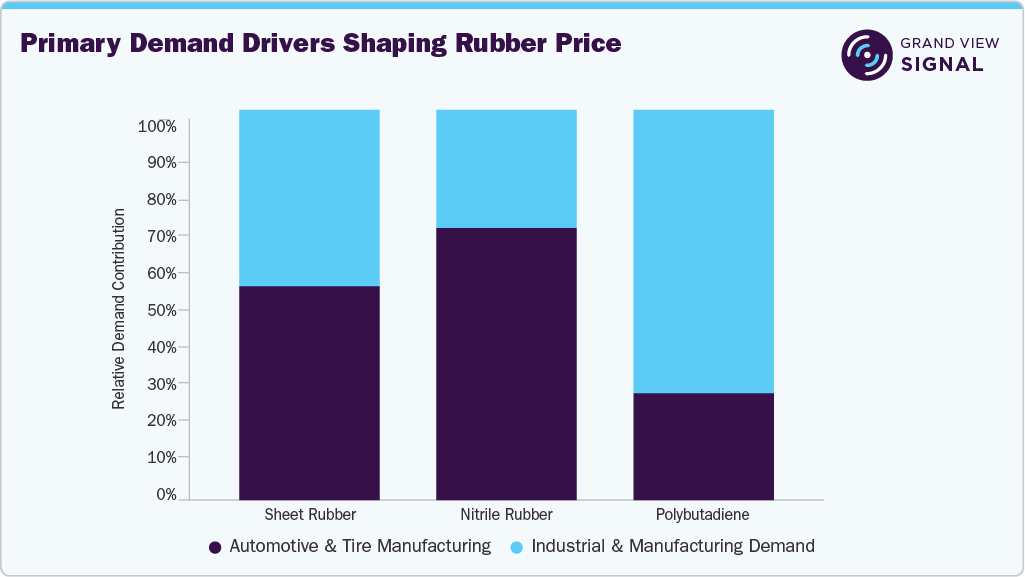
To protect margins against ongoing regional price splits and upstream monomer shifts, procurement executives must adopt a proactive, cross-commodity strategy.
- Deconstruct Supplier Formula Quotes: Unbundle supplier price proposals by breaking down raw material inputs into their core feedstock components. Verify whether proposed cost increases stem from real upstream monomer movements or unvalidated vendor margin expansions.
- Leverage Geographic Arbitrage: Establish dual-sourcing capabilities that enable purchasing teams to shift volumes between domestic sheet rubber and imported grades when regional price spreads widen beyond historical norms.
- Implement Dynamic Indexation: Transition long-term purchasing contracts away from static monthly averages toward dynamic, index-linked pricing structures that incorporate real-time natural and synthetic benchmarks.
Get detailed driver impact analysis on rubber prices. Request Free Access to Grand View Signal
Transforming Rubber Commodity Intelligence with Grand View Signal
Managing rubber procurement in an environment marked by weather disruptions, diverging regional prices, and volatile petrochemical feedstocks makes static, annual RFPs and lagging monthly averages a major operational liability. Category managers can no longer rely on unexamined supplier quotes or high-level commodity indices that fail to reflect actual regional market conditions.
Grand View Signal bridges the critical gap between reactive spot purchasing and predictive risk management through a unified, SaaS-driven commodity price intelligence framework. By combining high-frequency spot assessments across global natural rubber grades (such as Indian RSS3 and U.S. RSS3) with continuous tracking of upstream monomer feedstocks like Butadiene and Styrene, Signal isolates genuine cost-driver shifts from arbitrary supplier surcharges.
This multi-layered market visibility enables procurement and finance leaders to audit vendor pricing against verifiable benchmark trajectories, identify cost-saving material substitution options, and negotiate resilient, index-linked contracts. By replacing reactive buying habits with real-time commodity data, forward-thinking enterprise procurement teams can mitigate margin risk, optimize sourcing schedules, and turn global rubber market volatility into a measurable, long-term competitive advantage.
Read our latest articles on
- What Is Commodity Price Intelligence? A Definitive Guide
- Mastering EU PPWR Sourcing Through Commodity Price Intelligence
- Top 5 Factors That Cause Raw Material Price Spikes (And How to Prepare)
- How Steel Scrap Prices Are Reshaping the Decarbonization Agenda for Steelmakers
- Managing Commodity Price Volatility in 2026: The Strategic Procurement Imperative
