Pages

Friday, August 21, 2026

From Reactive Buying to Predictive Procurement: The Future of Ferrous Metals Pricing

Navigating the global ferrous complex requires balancing macro-level trade shifts with regional pricing pressures, particularly as raw material volatility continues to squeeze mill margins and procurement budgets. This divergence is particularly evident in the U.S. rebar construction steel segment, where steady federal infrastructure spending drives an estimated 12.8% Y-o-Y growth, yet fluctuating Electric Arc Furnace (EAF) scrap costs make real-time visibility into local supply-demand spreads critical.

By delivering dynamic commodity pricing intelligence across the entire ferrous value chain, platforms such as Grand View Signal provide commercial teams with real-time price assessments, regional arbitrage tracking, and forward-looking forecast models.

Primary Demand Drivers Shaping Ferrous Metals Price, July 2026

Here are the five key drivers currently shaping global iron ore, finished steel, and scrap dynamics.

1. Chinese Iron Ore: Resilient Imports Meet Upstream Supply Expansion

Despite persistent weakness in China’s real estate sector, Chinese iron ore demand showed surprising resilience in mid-2026. Iron ore imports hit a six-month high as domestic mills stepped in to restock raw materials amid constrained local mining output. Daily crude steel production stayed firm, providing an essential floor for iron ore prices.

This structural shift away from traditional supply channels is already underway. On January 17, a shipment of iron ore equivalent to approximately 14,286 TEUs pulled into Majishan Port in Zhejiang Province, China. Rather than originating from Australia or Brazil, which account for 69% and 21% of Chinese iron ore imports, respectively, this cargo arrived from Guinea, marking the first maiden delivery from Simandou, the world’s largest untapped deposit of high-grade iron ore.

Expanding seaborne supply from Simandou, alongside steady flows from Australia and Brazil, has largely removed fears of immediate physical shortages. With port stockpiles remaining elevated, mills stay disciplined, avoiding aggressive inventory accumulation while selectively favoring high-grade ores such as Simandou’s to boost blast furnace productivity and curb emissions.

  • What to Watch Next: Track port inventory drawdowns against blast furnace operational rates across major Chinese steelmaking hubs like Tangshan, alongside monthly shipment volumes originating from Guinea’s emerging export terminals.

Schedule a free demo of Grand View Signal to get real-time preview of price fluctuations in the Ferrous Metals Sector

2. Chinese Steel Markets: Firm Production vs. Weather-Delayed Demand

A sharp internal division defines China’s domestic steel market. While crude steel output remains surprisingly steady, downstream consumption has lagged. Inventories of the five main finished steel products increased by 3.6% in early July as adverse weather and weak downstream demand disrupted construction activity.

While flat steel products such as Hot-Rolled Coil (HRC) received mild support from manufacturing and export channels, despite an approximate 2.0% month-on-month dip in July 2026, while long steel products such as rebar and wire rod faced severe inventory accumulation. With property investment muted and finished steel margins squeezed, mills have resisted paying higher prices for raw feedstocks such as iron ore, metallurgical coke, and scrap.

  • What to Watch Next: Monitor the post-rainy season recovery rate in domestic rebar purchasing and track whether mills initiate voluntary production cuts to defend operating margins.

3. The Multi-Speed Global Recovery: Growth in India and the U.S.

In contrast to China's property-led slowdown, India and the U.S. provided vital support to global steel demand. India’s crude steel production expanded strongly year-on-year by 3.9% in June and finished steel production rose by 6.0%. This robust domestic demand helped insulate Indian steelmakers and support regional pricing.

Similarly, the U.S. steel market benefited from disciplined supply management, planned mill maintenance outages, and ongoing trade protection. While buyers in both nations remain cautious about broader macroeconomic uncertainties, these two regions serve as essential counterweights to European and Chinese demand headwinds.

Analyzing Regional Spreads: Disconnections between regional markets make cross-border price arbitrage difficult to assess. Utilizing commodity pricing intelligence through platforms allows commercial teams to monitor regional price differentials, such as the widening spread between Chinese HRC export offers and domestic U.S. or Indian mill quotes, enabling more precise export and procurement strategies.

  • What to Watch Next: Track Indian domestic infrastructure budget disbursements and monitor capacity utilization rates among key U.S. Electric Arc Furnace (EAF) operators following maintenance turnarounds.

Get historical, current, and forecast ferrous metals price assessments. Request Free Access to Grand View Signal

4. Trade Protectionism and the Rerouting of Global Steel Flows

Global steel trade is increasingly dictated by regulatory policies rather than pure supply-and-demand fundamentals. A rising wave of trade defense mechanisms, ranging from preliminary anti-dumping duties on hot-dip galvanized steel in Japan to ongoing HRC investigations in India and stricter tariff-free import quotas in the UK, is reshaping traditional trade corridors.

As major economies enforce national security tariffs and safeguard quotas to shield local producers from lower-priced material, global steelmakers are forced to re-route cargoes to un-shielded secondary markets. This regulatory friction creates localized price premiums and artificially suppresses prices in unprotected import destinations.

  • What to Watch Next: Follow final anti-dumping determinations across Asian import hubs and track potential shifts in trade flows toward Latin America and Southeast Asia.

5. Seaborne Scrap Weakness and the European Summer Slowdown

The deep-sea steel scrap market experienced a mid-year lull, primarily driven by reduced purchasing from Turkey, the world’s premier scrap importer. Weak finished steel export demand forced Turkish mills to maintain strict cost discipline, putting pressure on global Heavy Melting Scrap (HMS) benchmarks, and experienced roughly 9.4% Y-O-Y drop, where prices were 320 USD/ton in July 2026.

In Europe, the annual summer holiday slowdown, combined with low river levels that restricted barge transportation along key waterways like the Rhine, further dampened domestic scrap consumption. However, a clear structural dichotomy is emerging: while lower-quality scrap remains under pressure, prime industrial scrap grades continue to attract a structural premium, driven by long-term EAF expansions and green steel decarbonization targets.

Tracking Upstream Feedstock Trends: With pricing tools, market analysts can track price spreads between deep-sea scrap, domestic scrap, and prime DRI/HBI alternatives, helping steelmakers optimize furnace charge costs in real time.

  • What to Watch Next: Watch for a post-holiday rebound in Turkish deep-sea scrap bookings and track price spreads between prime industrial scrap and lower-grade HMS scrap as green steel mandates expand.

Access commodity-wise monthly forecast datasets for the next 6 months. Request Free Access to Grand View Signal

Strategic Takeaway: From Reactive Buying to Predictive Intelligence

The global steel and iron ore complex is moving away from synchronized global cycles toward a fragmented, multi-speed landscape defined by regional policies, weather disruptions, and trade protectionism.

Successfully navigating this volatility requires commercial teams to move beyond static, backward-looking data. By integrating holistic market intelligence platforms like Grand View Signal, procurement officers and commercial strategists gain the real-time visibility needed to transform market turbulence into a distinct competitive advantage through:

  • Monthly Price Assessments (Granular ASP Tracking): Access geographic-specific assessments of Average Selling Prices (ASP) across feedstocks, polymers, and metals, preventing procurement teams from overpaying during sudden spot-market spikes.
  • Longitudinal Historical Benchmarking: Evaluate over a decade of structured historical pricing records across 200+ commodities, enabling commercial leaders to identify multi-year price cycles and negotiate stronger contract terms.
  • Predictive Pricing & Forecast Modeling: Combine quantitative analytics and key market variables to project short- and medium-term price trends, helping finance executives transition to proactive, margin-protective sourcing.
  • Regional Risk & Volatility Analytics: Track trade barriers, tariffs, and shipping disruptions using proprietary volatility indices, allowing businesses to optimize cross-border supply chains and capture price arbitrage opportunities.
  • Cost-Structure & Margin Decomposition: Deconstruct commodity price points into raw input costs, logistics surcharges, and energy spreads, equipping commercial teams with data-backed transparency to defend profit margins during contract renegotiations.

Read our latest article on how Grand View Signal can assist procurement team with EU PPWR compliance

Thursday, August 20, 2026

How Geopolitical Disruptions Are Reshaping Plastics Prices?

The plastics converter floor used to operate on predictable rhythms: secure long-term resin contracts, run high-volume production cycles, and pass incremental feedstock shifts down the supply chain.

However, sudden crude oil swings, unexpected feedstock outages, shifting maritime trade routes, and aggressive sustainability mandates have fundamentally decoupled resin pricing from traditional seasonal trends. Today, raw material cost fluctuations hit converter balance sheets faster than contract terms can adapt, turning polymer procurement into one of the highest-risk operational functions in manufacturing.

Raw material volatility is hitting individual resin grades unevenly, with U.S. pricing ranging from a 15.1% jump in PP to a 29.1% decline in PET over the same period. Navigating such regional cost spreads requires real-time platform visibility. A SaaS-based commodity price intelligence platform, such as Grand View Signal, provides data transparency needed to hedge feedstock exposure, optimize sourcing, and protect operating margins.

Below is an analysis of the five primary structural forces driving price volatility and trade adjustments across the global polymer sector today.

Upstream Energy Volatility & Geopolitical Maritime Disruptions

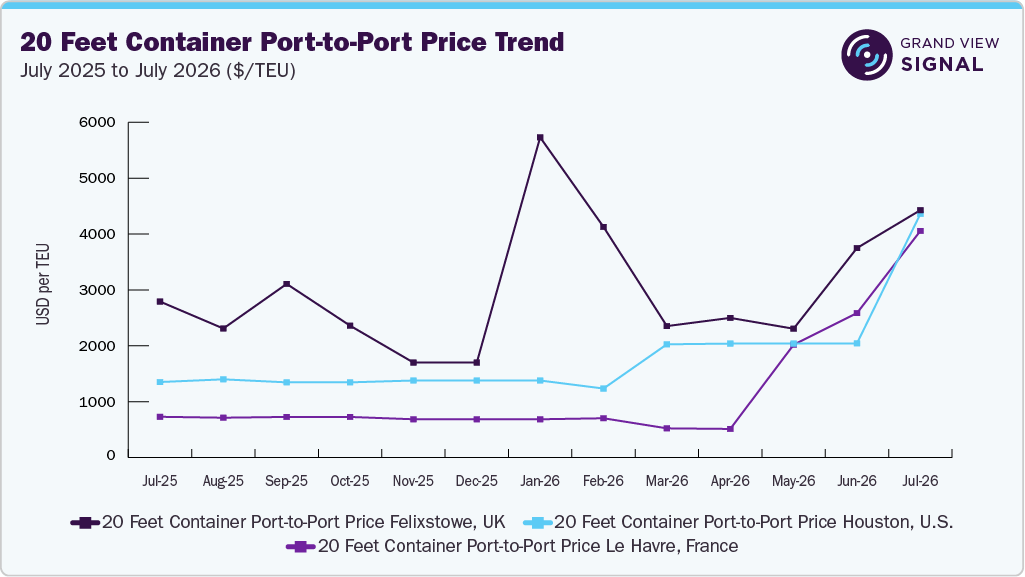
When security falters along major maritime transit corridors, ripple effects quickly destabilize downstream polymer supply chains. Geopolitical friction along key trade arteries forces shipping lines to reroute around alternative, longer sea channels. For instance, security disruptions around the Strait of Hormuz and Red Sea corridors forced resin-carrying vessels to bypass standard routes, adding up to 14 days to delivery schedules and surging container rates by over 300% on Asia-to-Europe routes.

Polypropylene (PP) and Polyethylene (PE) manufacturers face acute margin compression as underlying monomer contract settlements fluctuate month-over-month. For instance, in early July, CFR China polymer-grade propylene rallied to $810/MT, marking a 5% month-on-month gain. This upward momentum was backed by robust demand for PP, 2-EH, and n-butanol, which drove operating rates above 90% and lifted PDH margins to a three-month high.

The impact of these monomer cost spikes varies across global processing markets:

  • Import-Dependent Processors: Regions relying on imported monomer intermediates or foreign resin shipments face combined cost increases from elevated freight surcharges and high raw feedstock quotes.
  • Vertically Integrated Producers: Integrated chemical complexes with direct access to low-cost ethane or local refining streams retain a distinct cost advantage, keeping regional resin pricing uneven globally.

Schedule a free demo of Grand View Signal to get real-time preview of price fluctuations in the Plastics Sector

Resin Inventory Squeezes and Production Bottlenecks

Regional resin supplies often tighten abruptly due to scheduled plant turnarounds, unplanned feedstock outages, or inventory destocking along major trade routes.

When major regional petrochemical hubs experience supply contractions, downstream converters, ranging from thermoformers to blow molders, face localized availability crunches. The resulting imbalance between immediate resin demand and tight physical inventory drives rapid rallies in spot pricing across major commodity resin lines:

  • Polyethylene (PE) & Polypropylene (PP): Tighter monomer supply and reduced polymer plant utilization directly drive up quotes for film-grade resins, injection molding compounds, and raffia grades.
  • Polyvinyl Chloride (PVC): High underlying energy costs for chlor-alkali production, paired with tight vinyl chloride monomer (VCM) supplies, squeeze margin profiles for pipe, profile, and sheet manufacturers.
  • Polystyrene (PS) & PET: Paraxylene and styrene monomer shortfalls quickly feed into cost increases for rigid packaging, thermoforming sheet, and bottle-grade resins.

Because end-market buyers remain sensitive to finished-goods pricing, plastic processors often struggle to fully pass on these sudden resin price hikes, putting converter profit margins under severe strain.

Get historical, current, and forecast plastics price assessments. Request Free Access to Grand View Signal

Regulatory Imperatives & Sustainability Mandates

Plastic raw material markets are increasingly shaped by administrative policies, quality control measures, and evolving circular economy mandates. Policymakers and industry bodies worldwide are introducing targeted regulatory measures that alter resin trade flows and processing specifications.

Across major markets, regulatory shifts are reframing raw material sourcing:

  • Recycled Content & EPR Mandates: Enforced minimum recycled content rules create intense supply-demand friction between virgin resin markets and premium-priced PCR grades. A prime example is California’s AB 793, which requires plastic beverage containers sold in the state to contain at least 25% post-consumer recycled (PCR) content, escalating to 50% by 2030. Converters that fail to hit these precise material blends face severe monetary penalties per pound of non-compliant plastic, fundamentally altering raw resin purchasing priorities.
  • Quality & Import Regulations: Evolving trade standards, quality control orders (QCOs), and localized tariff adjustments require converters to quickly evaluate and certify alternative international resin suppliers to avoid operational downtime.
  • Customs and Duty Adjustments: Tactical adjustments in trade duties enable local processing plants to import crucial polymer feedstocks or specialty additives when regional production falls short.

These fast-evolving regulatory frameworks mean that buyers must monitor not only pure market economics but also compliance and quality standards when selecting raw material streams.

Mismatched Operating Costs and Cautious Downstream Demand

While upstream monomer and resin prices face upward pressure, the broader plastics industry continues to operate in an environment of selective downstream end-user purchasing.

Key demand sectors, including residential construction, automotive production, consumer electronics, and general packaging, are maintaining cautious procurement approaches. Without aggressive consumer pull from end markets, resin converters and compounders find it challenging to implement broad price pass-throughs across finished packaging films, molded parts, and extruded profiles. As a result, price gains remain highly concentrated in specific, physically constrained resin grades rather than representing a universal, demand-driven market expansion.

Access commodity-wise monthly forecast datasets for the next 6 months. Request Free Access to Grand View Signal

Strategic Shift Toward Supply-Chain Localization & Material Alternative Blending

To insulate themselves from persistent global freight shocks and feedstock volatility, major plastic-producing regions are investing heavily in localized processing hubs and expanded domestic resin capacity.

At the same time, converters and brand owners are actively restructuring their raw material formulas to manage costs and maintain supply continuity:

  • Regional Petrochemical Expansion: Expanding domestic resin production capacity across key industrial zones in North America, the Middle East, and Asia Pacific aims to reduce reliance on long-haul maritime transport for basic polymers.
  • Material Switching & Down-Gauging: Packaging and industrial molders are optimizing part design through down-gauging, high-performance polyolefin blends, and alternative substrate integration to trim per-unit polymer consumption.
  • Localized Sourcing Networks: Converters are moving away from single-source import strategies, establishing multi-regional resin supply contracts to hedge against localized plant shutdowns and logistics choke points.

How Grand View Signal Solves the Plastics Industry's Volatility Crisis

Operating in an era of feedstock price spikes, sudden refinery turnarounds, and shifting environmental mandates requires moving beyond reactive decision-making. Plastics industry leaders can no longer rely on delayed price reports or informal market rumors.

This is where Grand View Signal serves as a strategic technology solution, turning complex raw material data into actionable intelligence:

  • Mitigating Resin Price Swings: When upstream energy and monomer markets fluctuate, Signal delivers real-time price assessments across major commodity polymers like PE, PP, PVC, PET, and PS. Its analytics cover monthly, quarterly, annual, and multi-year timeframes to help teams manage risk. Procurement teams can track the true market-referenced selling price (MRSP) across target regions to optimize purchasing schedules and hedge raw material costs.
  • Predicting Supply Outages: Instead of being caught unprepared by sudden resin destocking or regional turnaround schedules, Signal combines longitudinal historical datasets with forward-looking forecast models. This enables converters and compounders to anticipate upstream price spikes before derivative product lines suffer margin compression.
  • Navigating Trade and Policy Shifts: As nations adjust trade tariffs, implement quality standards, or enforce post-consumer recycled mandates, Signal tracks policy developments and regional risk radars. Subscribing organizations can benchmark alternative resin grades and align sourcing footprints with emerging regulatory requirements.
  • Defending Processing Margins: To manage the disconnect between elevated resin costs and cautious end-market demand, Signal offers granular cost-structure decomposition and predictive risk modeling. This empowers commercial and purchasing teams to negotiate better contract terms, defend operating margins, and execute data-backed pricing strategies.

Managing resin price swings requires constant market foresight.  Grand View Signal targets this volatility by combining live pricing updates, deep historical trends, and forward-looking forecast models across 200 commodities. By monitoring shifting feedstock prices, regulatory updates, and regional cost spreads, Signal empowers procurement and finance leaders to shift from reactive purchasing to a strategic, margin-defending sourcing approach.

Read our latest article on how Grand View Signal can assist procurement team with EU PPWR compliance

Wednesday, August 19, 2026

Global Energy Prices in 2026: Monthly Trends and Market Outlook

Energy Pricing Intelligence - Executive Summary

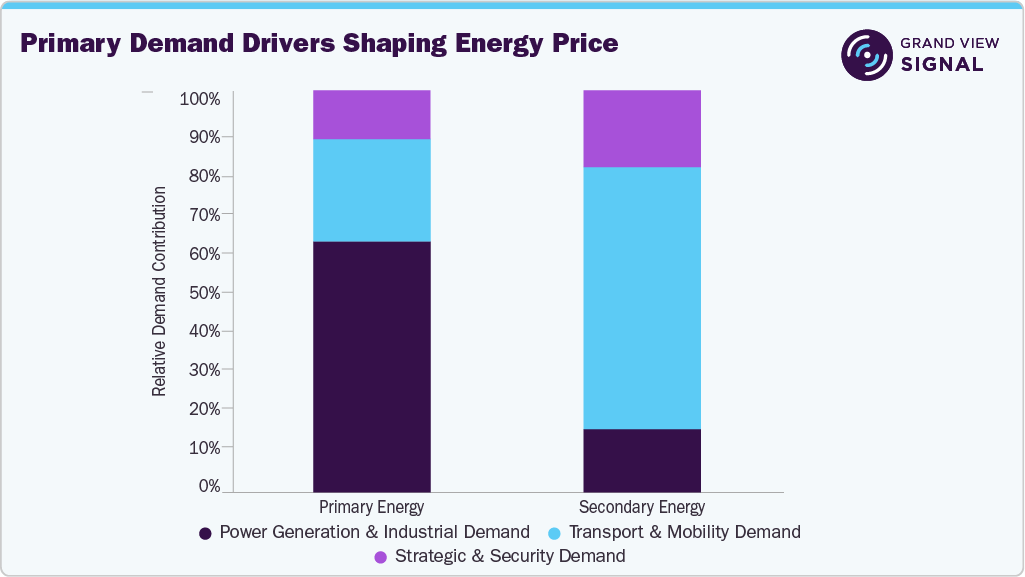
Energy pricing intelligence covers primary and secondary energy commodities, with July 2026 showing significant shifts across both segments. In primary energy, crude oil remained volatile early in the month as expected higher OPEC+ supply was balanced against Middle East supply risks, before prices softened later as reduced U.S.–Iran tensions lowered the Strait of Hormuz risk premium. However, Gulf shipping routes, refinery operations, LNG availability, and inventory levels remained key concerns. Secondary energy markets recorded mixed movements, with natural gas and LNG remaining relatively tight due to shipping disruptions and Europe’s gas-storage rebuilding needs. Electricity demand stayed supported by cooling requirements, industrial activity, electric vehicles, and data centers, while regional power prices varied with temperatures, fuel costs, renewable generation, and available capacity. Coal retained selective support for power generation amid high gas costs and fuel-security concerns, while refined petroleum products followed lower crude prices but remained influenced by summer transport demand and refinery availability.

Primary Demand Drivers Shaping Energy Price, July 2026

Key Price Developments & Insights

  • Crude oil prices softened in late July as the U.S.-Iran truce reduced the immediate Strait of Hormuz supply-risk premium.
  • OPEC+ output policy remained a key crude oil driver, with the August supply increase raising expectations of higher availability.
  • Natural gas and LNG markets remained tighter as supply and shipping stayed vulnerable to Middle East-related disruptions.
  • European gas markets focused on accelerating storage injections from below-normal levels, with higher LNG imports needed ahead of winter despite no immediate supply-security threat.
  • Electricity demand remained supported by cooling needs, industrial activity, EVs, and data centers, sustaining demand for power-generation fuels despite weaker crude prices.

Top Performing Energy Commodity

  • Top Mover: Natural Gas
  • Average MoM Growth (top 3 geographies): 19.4%
  • Volatility Level: Elevated

Schedule a free demo of Grand View Signal to get real-time preview of price fluctuations in the Energy Sector

Energy Sector Coverage and Key Price Influencers

1. Primary Energy

Primary energy prices showed mixed movement in July 2026, with crude oil weakening late in the month as OPEC+ supply expectations rose and Middle East risk eased. Natural gas and LNG remained comparatively firm due to shipping-related supply risks and European storage needs, while coal gained selective support from power-generation fuel switching. Uranium remained driven by long-term nuclear fuel security and reactor development.

Key Pricing Influencers:

  • OPEC+ August output increase and crude oil supply expectations.
  • Late-July easing of the Middle East crude oil risk premium.
  • LNG availability and European gas storage rebuilding.
  • Selective coal use in power generation due to high gas costs.
  • Long-term nuclear fuel and uranium requirements.

2. Secondary Energy

Secondary energy prices in July 2026 reflected lower crude costs, seasonal transport demand, refinery availability, and strong electricity consumption. Refined petroleum products followed weaker crude prices but remained influenced by refinery operations, inventories, and seasonal demand. Electricity markets stayed active due to cooling needs, industrial activity, EVs, and rising data center power demand, while LNG remained important for imported-gas markets as high prices and supply uncertainty encouraged cautious buying and fuel switching.

Key Pricing Influencers:

  • Lower crude prices affecting refined product costs.
  • Summer driving and transport fuel demand.
  • Refinery availability and inventory conditions.
  • Higher electricity demand from cooling, industry, EVs, and data center’s.
  • LNG price sensitivity and fuel switching in power markets.

Get historical, current, and forecast energy price assessments. Request Free Access to Grand View Signal

Pricing Trends, July 2026

  • Primary Energy

Primary energy commodities showed mixed movement in July 2026 as crude oil, natural gas, LNG, coal, and uranium responded to different market drivers. Crude oil shifted from early-month support from Middle East supply and shipping risks to weaker prices later as the U.S.–Iran hostilities pause eased disruption concerns and OPEC+ supply expectations increased. Natural gas and LNG remained more resilient due to shipping risks, European storage rebuilding, and strong Asian summer power demand, while coal retained selective support where utilities sought to manage generation costs and LNG dependence. Uranium remained relatively stable, driven mainly by long-term nuclear fuel security and reactor development.

  • Secondary Energy

Secondary energy commodities showed mixed performance in July 2026, with refined petroleum products following softer crude prices while remaining influenced by summer transport demand, refinery availability, inventories, and shipping activity. Electricity markets stayed active due to cooling needs, industrial use, EVs, and data center demand, while elevated gas prices supported coal use in some regions despite lower gas prices easing power-price pressure elsewhere. LNG remained important for imported-gas markets, but supply uncertainty and high procurement costs kept price-sensitive buyers cautious.

Access commodity-wise monthly forecast datasets for the next 6 months. Request Free Access to Grand View Signal

Grand View Signal offers

Grand View Signal tracks 200 commodities across multi-countries and reconstructs the price history back to 2016. This way, decision-makers can see not just what a material costs, but the drivers impacting the same. The offering includes commodity price capture across 8 sectors.

  • Weekly Commodity Pulse - What changed across commodity markets this week - the panoramic view, in five minutes.
  • Why Prices Moved - A single commodity, taken apart. Every driver, ranked, with the causal chain traced.
  • Risk Watch - What could disrupt supply in the next four to eight weeks, with exposure graded.
  • Decision Brief - The stance, the triggers that would change it, and the six-month forecast.

Explore Grand View Signal and access the full commodity price database and analyst forecasts.

Read our latest article on how Grand View Signal can assist procurement team with EU PPWR compliance

Tuesday, August 18, 2026

Rubber Price Trends in 2026: Key Market Developments and Outlook

Rubber Pricing Intelligence - Executive Summary

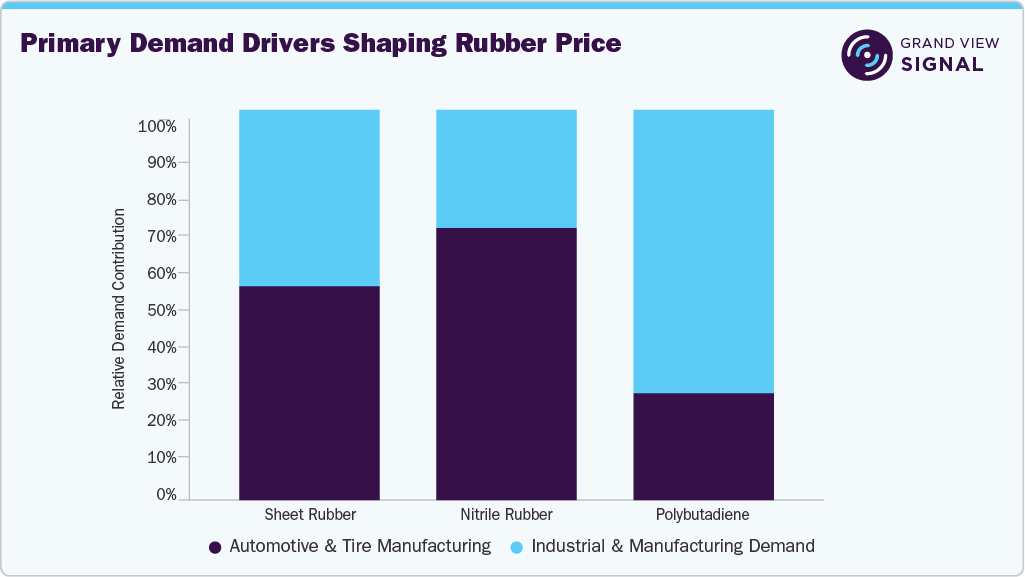
Rubber pricing intelligence covers natural rubber (RSS3) and synthetic rubber. Rubber markets recorded mixed movement during July 2026, with natural rubber strengthening in the first half before weakening toward month-end as buyers completed immediate requirements, while Indian domestic sheet-rubber prices remained firm and Bangkok RSS3 and China’s monitored natural-rubber prices softened after mid-month recovery. Synthetic rubber saw a stronger mid-month recovery, with BR rebounding sharply during July 11–20 after early declines before losing momentum, while NBR recovered steadily and remained comparatively firm near month-end. Demand stayed uneven across tire and industrial-rubber sectors, with replacement tires performing better than original-equipment demand and automotive, footwear, hoses, seals, and belts supporting selective procurement, while European trade-policy changes and tighter UK waste-tire export controls heightened the importance of regional supply, compliance, and traceability.

Primary Demand Drivers Shaping Rubber Price, July 2026

Key Price Developments & Insights

  • Natural rubber strengthened in early July before correcting as restocking eased and buyers shifted to requirement-based procurement.
  • BR weakened early, recovered sharply mid-month, then moderated toward month-end.
  • NBR declined initially before steadily recovering in the second half of July.
  • Indian sheet-rubber prices remained firm, while international RSS3 values eased, reflecting divergent domestic and global market conditions.
  • European tire trade conditions shifted following anti-dumping duties on passenger-car and light-lorry tires imported from China.

Top Performing Rubber Commodity

  • Top Mover: Acrylonitrile Butadiene Rubber (NBR)
  • Average MoM Growth (top 3 geographies): 1.0%
  • Volatility Level: Stable

Schedule a free demo of Grand View Signal to get real-time preview of price fluctuations in the Rubber Sector

Rubber Sector Coverage and Key Price Influencers

1. Natural Rubber

The Natural Rubber category covers RSS3 sheet rubber, widely used in tires, automotive components, conveyor belts, footwear, and technical rubber products. July pricing reflected variations in physical availability, procurement patterns, inventories, and tire-sector demand.

Key Pricing Influencers:

  • Weather and tapping conditions in producing countries
  • Tire and automotive demand
  • Physical inventories and export availability
  • Currency, freight and regional import economics

2. Synthetic Rubber

The Synthetic Rubber category covers BR and NBR, used in tires, footwear, seals, hoses, gaskets, cables, and other industrial applications. July price movements reflected differing purchasing patterns across tire and industrial-rubber markets.

Key Pricing Influencers:

  • Butadiene and acrylonitrile replacement costs
  • Tire and automotive-component production
  • Footwear and industrial-rubber demand
  • Producer availability, inventories and import conditions

Get historical, current, and forecast rubber price assessments. Request Free Access to Grand View Signal

Pricing Trends, July 2026

  • Natural Rubber

Natural rubber prices recovered in early and mid-July before weakening toward month-end, with China’s standard-rubber price declining during 1–10 July, recovering modestly during 11–20 July, and then softening as buying urgency remained limited. Regional markets diverged, as Indian RSS4 and RSS5 prices stayed firm while Bangkok RSS3 declined, reflecting tighter Indian domestic availability and differing procurement, inventory, currency, and replacement-tire conditions across regions.

  • Synthetic Rubber

Synthetic rubber recorded a stronger mid-July recovery than natural rubber, with Chinese BR9000 prices declining early, rising sharply during 11–20 July on immediate restocking needs after June’s weakness, and easing in the final week as processors avoided large inventories. NBR followed a steadier recovery, weakening initially before strengthening through the second half and stabilizing near late-July highs, supported by diverse demand across seals, hoses, gaskets, footwear, cables, and other industrial applications, while purchases remained tied to confirmed downstream orders.

Access commodity-wise monthly forecast datasets for the next 6 months. Request Free Access to Grand View Signal

Rubber Key Market Drivers

  • Regional natural-rubber availability and controlled procurement: China’s rubber market recovered modestly mid-month before correcting, while Indian RSS prices remained firm and Bangkok RSS3 declined, reflecting regional supply, demand, currency, and import conditions. Buyers focused on immediate needs, limiting restocking and late-July gains.
  • Sharp mid-month BR recovery: BR prices fell early July before rebounding sharply during 11–20 July as buyers covered short-term needs after June’s weakness. Cautious downstream demand limited inventory building, causing prices to moderate toward month-end.
  • Gradual NBR recovery and application-specific demand: NBR weakened initially before recovering steadily and stabilizing near month-end, supported by demand from automotive, industrial, footwear, cable, and other applications. Purchasing remained focused on confirmed requirements amid uneven manufacturing demand.
  • Uneven replacement and original-equipment demand: Replacement-tire demand remained more resilient than original-equipment demand in several markets, while higher manufacturing, logistics, and customs costs encouraged disciplined inventory management and limited uniform growth in rubber consumption.
  • Trade defense, traceability, and regional supply chains: EU anti-dumping duties on Chinese passenger-car and light-lorry tires and new UK waste-export reporting requirements increased focus on regional sourcing, compliance, traceability, and recycling economics, influencing longer-term rubber demand and supply chains.

Get detailed driver impact analysis on rubber prices. Request Free Access to Grand View Signal

Grand View Signal offers

Grand View Signal tracks 200 commodities across multi-countries and reconstructs the price history back to 2016. This way, decision-makers can see not just what a material costs, but the drivers impacting the same. The offering includes commodity price capture across 8 sectors.

  • Weekly Commodity Pulse - What changed across commodity markets this week - the panoramic view, in five minutes.
  • Why Prices Moved - A single commodity, taken apart. Every driver, ranked, with the causal chain traced.
  • Risk Watch - What could disrupt supply in the next four to eight weeks, with exposure graded.
  • Decision Brief - The stance, the triggers that would change it, and the six-month forecast.

Explore Grand View Signal and access the full commodity price database and analyst forecasts.

Read our latest article on how Grand View Signal can assist procurement team with EU PPWR compliance

Monday, August 17, 2026

Fertilizer Price Trends in 2026: What Global Buyers Need to Know?

Fertilizers Pricing Intelligence - Executive Summary

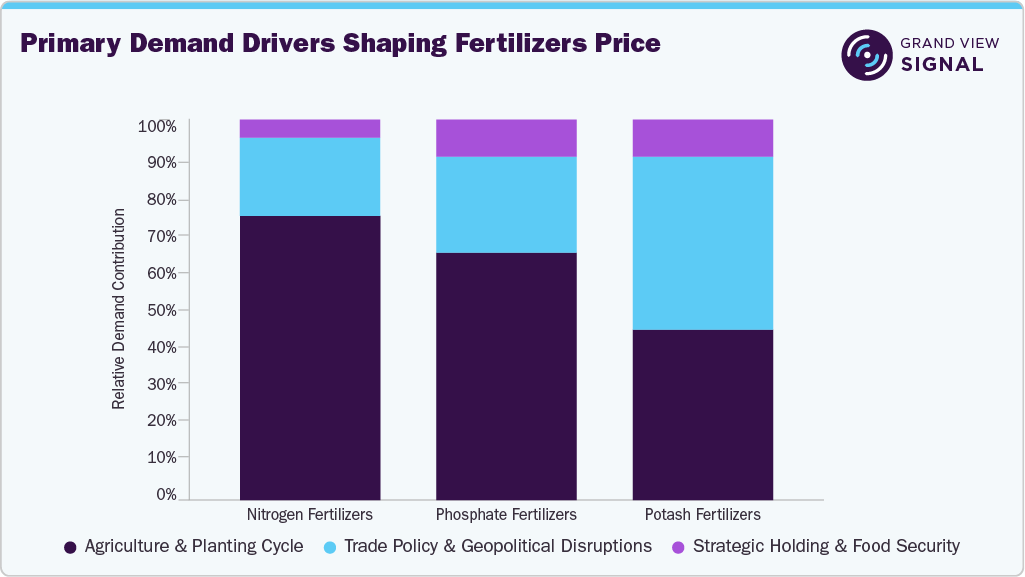
Fertilizers pricing intelligence covers nitrogen, phosphate and potash fertilizers. Fertilizer markets showed contrasting regional trends in July 2026. China’s domestic nitrogen market remained soft, with urea gradually weakening and ammonium sulfate easing after a brief mid-month recovery. In contrast, the global seaborne urea market strengthened due to constrained Middle Eastern exports, higher European production costs, and renewed importer activity. Phosphate and potash markets remained comparatively stable, with MAP, MOP, potassium nitrate, and SOP showing limited price movement amid adequate supplies and cautious procurement. Regional policies also influenced demand, with India maintaining comfortable Kharif supplies through domestic production and imports, while European countries introduced support measures to address rising fertilizer and energy costs.

Primary Demand Drivers Shaping Fertilizers Price, July 2026

Key Price Developments & Insights

  • Urea prices weakened in China but strengthened in the seaborne market amid tighter global supply.
  • Ammonium sulfate declined early, briefly recovered mid-month, then weakened again.
  • MAP remained stable, while MOP, potassium nitrate, and SOP showed stable to slightly weaker trends.
  • Government procurement, affordability, Middle Eastern disruptions, and cautious inventory management remained key price drivers.

Top Performing Fertilizers Commodity

  • Top Mover: Ammonium Biphosphate
  • Average MoM Growth (top 3 geographies): 1.0%
  • Volatility Level: Stable

Schedule a free demo of Grand View Signal to get real-time preview of price fluctuations in the Fertilizers Sector

Fertilizers Sector Coverage and Key Price Influencers

1. Nitrogen Fertilizers

The category includes Urea and Ammonium Sulfate, with July prices influenced by domestic supply, ammonia and natural gas costs, exports, seasonal demand, and government procurement.

Key Pricing Influencers:

  • Natural-gas and ammonia availability
  • Domestic production and plant operating rates
  • Export policy and seaborne supply
  • Agricultural procurement and inventories

2. Phosphate Fertilizers

The category includes MAP, which provides nitrogen and phosphorus. July pricing was shaped by phosphate rock, Sulphur, ammonia, and phosphoric acid costs, producer output, exports, and seasonal demand.

Key Pricing Influencers:

  • Phosphate-rock and phosphoric-acid availability
  • Ammonia and Sulphur costs
  • Chinese export availability
  • Agricultural and compound-fertilizer demand

3. Potash Fertilizers

The category includes MOP, Potassium Nitrate, and SOP, serving bulk, horticultural, fertigation, and chloride-sensitive applications. July prices were influenced by producer supply, imports, affordability, inventories, and specialty-crop demand.

Key Pricing Influencers:

  • Major producer and import availability
  • Crop economics and application timing
  • Freight and regional import costs
  • Demand from specialty and chloride-sensitive crops

Get historical, current, and forecast fertilizers price assessments. Request Free Access to Grand View Signal

Grand View Signal offers

Grand View Signal tracks 200 commodities across multi-countries and reconstructs the price history back to 2016. This way, decision-makers can see not just what a material costs, but the drivers impacting the same. The offering includes commodity price capture across 8 sectors.

  • Weekly Commodity Pulse - What changed across commodity markets this week - the panoramic view, in five minutes.
  • Why Prices Moved - A single commodity, taken apart. Every driver, ranked, with the causal chain traced.
  • Risk Watch - What could disrupt supply in the next four to eight weeks, with exposure graded.
  • Decision Brief - The stance, the triggers that would change it, and the six-month forecast.

Explore Grand View Signal and access the full commodity price database and analyst forecasts.

Read our latest article on how Grand View Signal can assist procurement team with EU PPWR compliance

Thursday, August 13, 2026

Chemical Price Trends in 2026: Key Factors Shaping Global Markets

Chemicals Pricing Intelligence - Executive Summary

Chemicals pricing intelligence covers organic, inorganic, and specialty chemicals. Organic markets were mixed but generally firmer in July 2026, with aromatics and selected downstream intermediates gaining support as renewed Middle East tensions raised crude-linked feedstock costs, tightened regional cargo availability, and encouraged Chinese spot buying; low Chinese benzene stocks and refinery maintenance further constrained prompt supply, although weak downstream margins limited aggressive purchasing. Inorganic markets remained comparatively stable to weak, with cautious demand for caustic soda and soda ash, while sulphuric and nitric acid saw more balanced regional conditions; bromine strengthened in China, whereas carbon black remained influenced by feedstock costs and measured tire and rubber demand. European markets continued to face weak orders, high energy costs, and global overcapacity, while Middle Eastern supply disruptions and ongoing regional chemical investments remained key influences on global trade.

Primary Demand Drivers Shaping Chemicals Price, July 2026

Key Price Developments & Insights

  • Aromatics strengthened in July due to tight imports, low Chinese benzene stocks, refinery maintenance, and feedstock concerns.
  • IPA and methanol remained sensitive to West Asian supply disruptions, especially in India, which took steps to secure feedstock and ease import restrictions.
  • Caustic soda and soda ash stayed subdued due to adequate supply and cautious industrial demand.
  • European chemical markets faced high energy costs, weak demand, reduced operating rates, and rising Asian competition.
  • Middle Eastern disruptions impacted chemical shipments and feedstock availability, while Saudi Arabia and the UAE continued expanding domestic downstream chemical value chains.

Top Performing Chemicals Commodity

  • Top Mover: Benzene
  • Average MoM Growth (top 3 geographies): 12.2%
  • Volatility Level: High

Schedule a free demo of Grand View Signal to get real-time preview of price fluctuations in the Chemicals Sector

Chemicals Sector Coverage and Key Price Influencers

1. Organic Chemicals

Covers alcohols & glycols, amines, aromatics & olefins, monomers, resin intermediates, organic acids, plasticizers, solvents, ketones, and esters. July pricing was led by aromatics and selected intermediates, while alcohols, acids, and solvents showed mixed movement.

Key Pricing Influencers:

  • Crude oil, naphtha, benzene, propylene, and methanol costs
  • Plant maintenance, operating rates, and import availability
  • Demand from plastics, coatings, textiles, resins, and pharmaceuticals
  • Downstream margins and inventory-management decisions

2. Inorganic Chemicals

Covers alkalis & bases, halogens & fluorochemicals, boron & silicon compounds, inorganic salts, mineral acids, and sulphur & carbon products. Pricing remained largely subdued in July, with bromine showing firmer conditions.

Key Pricing Influencers:

  • Salt, sulphur, phosphate rock, energy, and mineral costs
  • Demand from alumina, glass, fertilizers, mining, and water treatment
  • Chlor-alkali operating rates and regional inventory availability
  • Sulphur and acid trade flows and shipping conditions

3. Specialty Chemicals

Covers ammonium persulfate, sodium persulfate, and sodium hypochlorite, which showed relatively narrow price movement due to application-specific demand.

Key Pricing Influencers:

  • Water-treatment and disinfection requirements
  • Polymerization and resin-production activity
  • Electronics, textiles, and metal-processing demand
  • Electricity and raw material costs

Get historical, current, and forecast chemicals price assessments. Request Free Access to Grand View Signal

Grand View Signal offers

Grand View Signal tracks 200 commodities across multi-countries and reconstructs the price history back to 2016. This way, decision-makers can see not just what a material costs, but the drivers impacting the same. The offering includes commodity price capture across 8 sectors.

  • Weekly Commodity Pulse - What changed across commodity markets this week - the panoramic view, in five minutes.
  • Why Prices Moved - A single commodity, taken apart. Every driver, ranked, with the causal chain traced.
  • Risk Watch - What could disrupt supply in the next four to eight weeks, with exposure graded.
  • Decision Brief - The stance, the triggers that would change it, and the six-month forecast.

Explore Grand View Signal and access the full commodity price database and analyst forecasts.

Read our latest article on how Grand View Signal can assist procurement team with EUPPWR compliance

Monday, May 18, 2026

Communication Software Market Transforming Hybrid Workplaces

The global communication software market was valued at USD 11.65 billion in 2025 and is projected to reach USD 33.87 billion by 2033, registering a CAGR of 14.4% from 2026 to 2033. The increasing dependence on digital communication technologies across industries has transformed communication software from a supporting business tool into a critical enterprise infrastructure component, significantly driving market growth.

The global transition toward remote and hybrid work models has fundamentally changed organizational operations, making communication software an essential business enabler. Companies are increasingly managing distributed teams across multiple geographies, which has accelerated the adoption of digital communication tools such as video conferencing, instant messaging, and collaboration platforms. This shift has created sustained demand for seamless, real-time communication solutions that allow employees to remain connected, collaborate efficiently, and maintain productivity regardless of location.

Communication Software Market Share

In addition, communication software supports employee engagement through virtual collaboration and team coordination. As hybrid work environments continue to become a long-term business strategy, organizations are investing heavily in advanced communication technologies to ensure operational continuity, business efficiency, and a consistent employee experience across workplaces.

The rapid expansion of cloud computing and Software-as-a-Service (SaaS) models is further accelerating growth in the communication software market. Cloud-based communication solutions provide businesses with scalability and flexibility, enabling organizations to easily expand or modify usage based on operational requirements. These solutions also reduce the need for significant upfront infrastructure investments, making advanced communication technologies more cost-effective. Subscription-based pricing models further lower adoption barriers, especially for small and medium-sized enterprises (SMEs), thereby encouraging widespread adoption across organizations of different sizes and industries.

Download a free sample copy of the Communication Software Market report to understand detailed coverage and inclusions in the final report

Key Market Trends & Insights

  • North America dominated the global communication software market in 2025, accounting for the largest revenue share of 36.04%. The region has one of the highest adoption rates of cloud-based and SaaS communication platforms due to their scalability, flexibility, and cost-efficiency benefits. Organizations across North America increasingly prefer cloud communication technologies to support evolving digital workplace environments, which continues to drive regional market growth.
  • By communication type, the video conferencing segment held the largest market share of 28.6% in 2025. The growing presence of global and geographically distributed workforces is a major factor supporting the adoption of video conferencing solutions. As businesses expand internationally, employees frequently operate from different locations and time zones, making traditional in-person collaboration less practical. Video conferencing enables real-time face-to-face communication, helping teams remain connected and aligned. It improves collaboration, accelerates decision-making processes, and reduces dependency on business travel, thereby lowering operational costs while maintaining communication effectiveness and productivity.
  • Based on deployment, the cloud-based (SaaS) segment dominated the market in 2025 with the largest revenue share. The segment’s growth is driven by lower upfront costs and flexible subscription-based pricing structures. Unlike conventional on-premises communication systems, cloud-based solutions eliminate the need for expensive hardware, infrastructure setup, and ongoing maintenance costs. Organizations instead pay predictable monthly or annual subscription fees, shifting technology spending from capital expenditure (CapEx) to operational expenditure (OpEx). This affordability has made advanced communication software more accessible to SMEs, significantly expanding market penetration and adoption across industries.
  • By enterprise size, the large enterprise segment accounted for the largest revenue share in 2025. Large organizations have extensive communication requirements due to operations spanning multiple departments, locations, and time zones. This creates strong demand for scalable and integrated communication platforms capable of handling large interaction volumes. Centralized communication solutions improve internal collaboration as well as communication with customers and business partners. These platforms help enhance operational efficiency, coordination, and productivity while enabling effective management of geographically dispersed teams and large-scale business operations.
  • Based on industry vertical, the healthcare and life sciences segment is expected to register the fastest CAGR from 2026 to 2033. The growing need for real-time clinical collaboration is a major driver behind communication software adoption in healthcare environments. Healthcare professionals require instant and reliable communication to coordinate patient care, discuss diagnoses, and respond efficiently during emergencies. Communication platforms facilitate seamless interaction among doctors, nurses, and specialists, improving information sharing, accelerating decision-making, enhancing patient outcomes, and increasing operational efficiency in healthcare systems.

Market Size & Forecast

  • 2025 Market Size: USD 11.65 Billion
  • 2033 Projected Market Size: USD 33.87 Billion
  • CAGR (2026-2033): 14.4%
  • North America: Largest market in 2025

Looking for more specific insights? Customize this report to suite your business needs

Key Companies & Market Share Insights

Major companies operating in the communication software market include Microsoft Corporation, Zoom Video Communications, Cisco Systems, Google, Salesforce, RingCentral, 8x8, Mitel, Avaya, Vonage, Twilio, Sinch, Bandwidth Inc., Slack Technologies, and Mattermost.

These companies are actively focusing on strategic initiatives such as new product launches, partnerships, collaborations, and business agreements to strengthen their competitive positions and expand their market presence globally.

Key Players

  • Microsoft Corporation
  • Zoom Video Communications
  • Cisco Systems
  • Google
  • Salesforce
  • RingCentral
  • 8x8
  • Mitel
  • Avaya
  • Vonage
  • Twilio
  • Sinch
  • Bandwidth Inc.
  • Slack Technologies
  • Mattermost

Conclusion

The global communication software market is expected to witness substantial growth over the forecast period, driven by the increasing adoption of remote and hybrid work environments, rapid cloud computing expansion, and growing reliance on digital collaboration tools. The demand for scalable, real-time, and cost-effective communication solutions continues to rise across industries as organizations prioritize operational efficiency and workforce connectivity. Furthermore, advancements in cloud-based technologies, SaaS models, and integrated collaboration platforms are expected to create significant growth opportunities for market participants through 2033.

Looking for a report customized to your requirements? Explore our Custom Research Offering

Grand View Research offers

  • Focused market intelligence reports on specific geographies or high-growth segments.
  • Extended forecast timelines for long-term planning.
  • Competitor Benchmarking and Supply Chain Analysis
  • Inclusion of regulatory and policy assessments.
  • Inclusion of custom data models, KPIs, or applications unique to your business
  • Specific high-impact Data Decks and Tables to support effective decision making

And much more…

Technical Glass Market Driving the Future of Smart Displays

The global technical glass market was valued at USD 33.1 billion in 2025 and is projected to reach USD 45.9 billion by 2033, expanding at a CAGR of 4.1% from 2026 to 2033. The market growth is primarily driven by the rapid expansion of the consumer electronics industry.

Technical glass market size and growth forecast (2023-2033)

The increasing adoption of smartphones, tablets, wearable devices, and advanced display technologies has created strong demand for high-performance glass solutions that offer enhanced optical clarity, scratch resistance, and durability. In addition, the growing adoption of flexible displays, augmented reality (AR), and virtual reality (VR) technologies has accelerated the demand for specialized technical glass used in screens, sensors, and optical components. Continuous advancements in electronics technology continue to act as a major growth driver for the market.

Technical glass products including low-emissivity glass, insulated glazing, and electrochromic glass are increasingly being utilized to improve energy efficiency by controlling heat and light transmission. The implementation of stricter environmental regulations and the growing global focus on sustainable and green buildings are encouraging developers to adopt advanced glass technologies. Furthermore, rapid urbanization and large-scale infrastructure development across emerging economies are significantly contributing to market growth.

Download a free sample copy of the Technical Glass Market report to understand detailed coverage and inclusions in the final report

Key Market Trends & Insights

  • Asia Pacific accounted for the largest revenue share of 33.4% in the global technical glass market in 2025. The regional market growth is mainly supported by rapid urbanization and extensive infrastructure development in countries such as China, India, and Southeast Asian nations. Expanding construction activities, including smart cities, commercial buildings, and high-rise residential projects, have increased the demand for high-performance and energy-efficient glass products. Governments across the region are also promoting green building initiatives and sustainable infrastructure development, which is accelerating the adoption of advanced technical glass solutions such as low-emissivity glass and smart glass technologies.
  • By type, the borosilicate glass segment dominated the market with a revenue share of 35.4% in 2025. The segment growth is primarily driven by rising demand from the pharmaceutical and life sciences industries. The increasing focus on biologics, biosimilars, and mRNA-based therapies has significantly increased the need for Type I borosilicate glass due to its superior chemical resistance and high hydrolytic stability. Compared to conventional glass materials, borosilicate glass minimizes alkali ion leaching into sensitive pharmaceutical formulations, ensuring improved product stability and patient safety.
  • Based on application, the automotive segment is expected to register the fastest CAGR of 5.5% from 2026 to 2033. Growth in this segment is supported by the increasing integration of advanced glass technologies in modern vehicles. Technical glass is extensively used in infotainment systems, instrument clusters, heads-up displays, and advanced driver assistance systems (ADAS), where high optical performance, durability, and temperature resistance are essential. The growing shift toward connected and autonomous vehicles is also driving demand for high-performance display glass and sensor-integrated glass components that enhance driver safety and user experience.

Market Size & Forecast

  • 2025 Market Size: USD 33.1 Billion
  • 2033 Projected Market Size: USD 45.9 Billion
  • CAGR (2026-2033): 4.1%
  • Asia Pacific: Largest market in 2025
  • Latin America: Fastest growing market

Looking for more specific insights? Customize this report to suite your business needs

Key Companies & Market Share Insights

Some of the leading companies operating in the technical glass market include AGC Inc., Corning Incorporated, and others.

  • AGC Inc., headquartered in Tokyo, is a global glass and materials company and a core member of the Mitsubishi Group. Established in 1907, the company has evolved from Japan’s first sheet glass manufacturer into a leading provider of glass, electronics materials, ceramics, and chemical solutions. AGC serves multiple industries including construction, automotive, electronics, and life sciences through advanced manufacturing technologies and continuous investments in research and development.
  • Corning Incorporated, based in Corning, New York, is a global technology company specializing in glass, ceramics, and advanced materials. Founded in 1851, the company has played a significant role in the development of modern specialty glass technologies. Corning operates across several business segments including display technologies, optical communications, environmental technologies, specialty materials, and life sciences, serving industries ranging from telecommunications to consumer electronics.

Key Players

  • AGC Inc.
  • Corning Incorporated
  • Fuyao Glass Industry Group Co., Ltd.
  • Guardian Industries
  • Nippon Electric Glass Co., Ltd.
  • NSG Group
  • PPG Industries, Inc.
  • Saint-Gobain
  • SCHOTT AG
  • Xinyi Glass Holdings Limited

Conclusion

The global technical glass market is expected to witness steady growth over the forecast period, driven by rising demand from the consumer electronics, automotive, pharmaceutical, and construction industries. Technological advancements in display systems, smart devices, and energy-efficient infrastructure are significantly increasing the adoption of advanced technical glass solutions. Additionally, the growing emphasis on sustainability, green buildings, and connected vehicle technologies is expected to create substantial growth opportunities for market participants through 2033.

Looking for a report customized to your requirements? Explore our Custom Research Offering

Grand View Research offers

  • Focused market intelligence reports on specific geographies or high-growth segments.
  • Extended forecast timelines for long-term planning.
  • Competitor Benchmarking and Supply Chain Analysis
  • Inclusion of regulatory and policy assessments.
  • Inclusion of custom data models, KPIs, or applications unique to your business
  • Specific high-impact Data Decks and Tables to support effective decision making

And much more…