Pages

Showing posts with label rubber price trends. Show all posts

Wednesday, September 2, 2026

Understanding the Global Rubber Market: Key Trends Reshaping Procurement Strategies

For B2B procurement leaders and supply chain managers in the rubber sector, managing raw material volatility requires looking beyond top-line price movements. Data captured through Grand View Signal shows that Indian RSS3 natural rubber prices surged by 33.5% year-over-year, escalating from 2,269 USD per ton in August 2025 to 3,028.90 USD per ton in August 2026. This dramatic shift highlights three dominant supply chain trends that are currently defining price movements across natural and synthetic rubber categories.
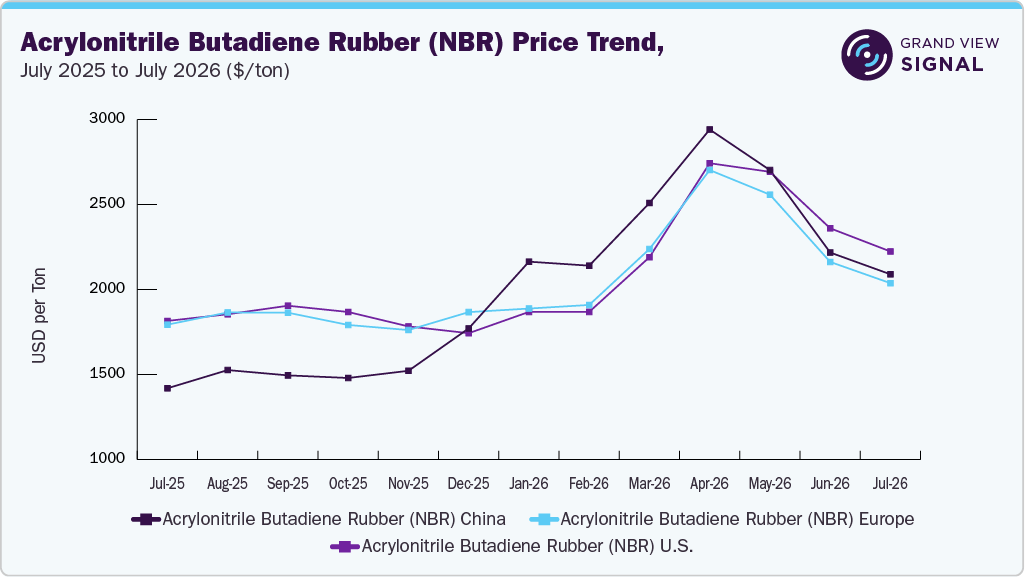
Acrylonitrile Butadiene Rubber (NBR) Price Trend, July 2025 to July 2026 ($/ton)

1. Fragmentation Between Domestic and International Natural Rubber Markets

Natural rubber pricing is showing sharp geographic divergence rather than following a uniform global trajectory. Regional prices are heavily dictated by localized physical availability, domestic demand, currency fluctuations, and import economics.

  • Domestic Tightness vs. International Softening: Indian domestic sheet-rubber reference prices have remained comparatively firm, driven by tight local availability and steady domestic procurement schedules. Conversely, international reference benchmarks such as Bangkok RSS3 values experienced notable declines during late-month trading periods.
  • Fluctuating Import Markets: In major Asian processing hubs like China, standard natural rubber prices moved from early-period weakness to a modest mid-month recovery, then lost momentum toward the end of the month.
  • Controlled Procurement: Across major regions, buyers are strictly purchasing against immediate manufacturing schedules rather than building aggressive inventory positions. This disciplined, hand-to-mouth procurement pattern continues to limit sustained upward price momentum.
  • Real-World Impact: Indian tire manufacturers (such as MRF and Apollo Tires) faced margin compression as domestic RSS4 sheet prices traded near all-time highs above ₹270–280/kg. To offset localized domestic premiums, major processors were forced to evaluate cheaper imported alternatives or adjust domestic blending ratios where import tariffs allowed.

Schedule a free demo of Grand View Signal to get real-time preview of price fluctuations in the Rubber Sector

2. Sharp Mid-Month Price Reversals in Butadiene Rubber (BR)

Synthetic rubber variants, particularly Butadiene Rubber (BR), recorded the most pronounced price volatility within the segment.

  • Rapid Price Spike: Following sustained early-period declines in major markets such as China, BR experienced a swift mid-month recovery as processors and traders returned to cover short-term operational needs.
  • Downstream Margin Pressure: The rapid rise in BR spot prices increased immediate replacement-cost pressures for tire manufacturers, industrial rubber goods producers, and footwear makers.
  • Cautious Late-Month Moderation: Because the price surge outpaced the speed of recovery in actual downstream end-user demand, buyers resisted aggressive inventory accumulation. As immediate buying urgency subsided, BR prices moderated from their peak while remaining higher overall than at the start of the month.
  • Real-World Impact: When Butadiene feedstock spikes ripple through synthetic rubber contracts, automotive component manufacturers and footwear producers (e.g., shoe sole compounders) struggle to pass on raw material costs to OEMs. Many compounders chose to pause non-essential production runs during mid-month spikes to avoid locking in high spot rates.

Access commodity-wise monthly forecast datasets for the next 6 months. Request Free Access to Grand View Signal

3. Measured Recovery in Acrylonitrile Butadiene Rubber (NBR)

Acrylonitrile Butadiene Rubber (NBR) exhibited a distinct, application-driven recovery path compared to the sharp movements seen in tire-centric materials.

  • Steady Second-Half Gains: After initial early-period softening, NBR prices strengthened steadily during the second half of the month, establishing itself as a top-performing rubber commodity.
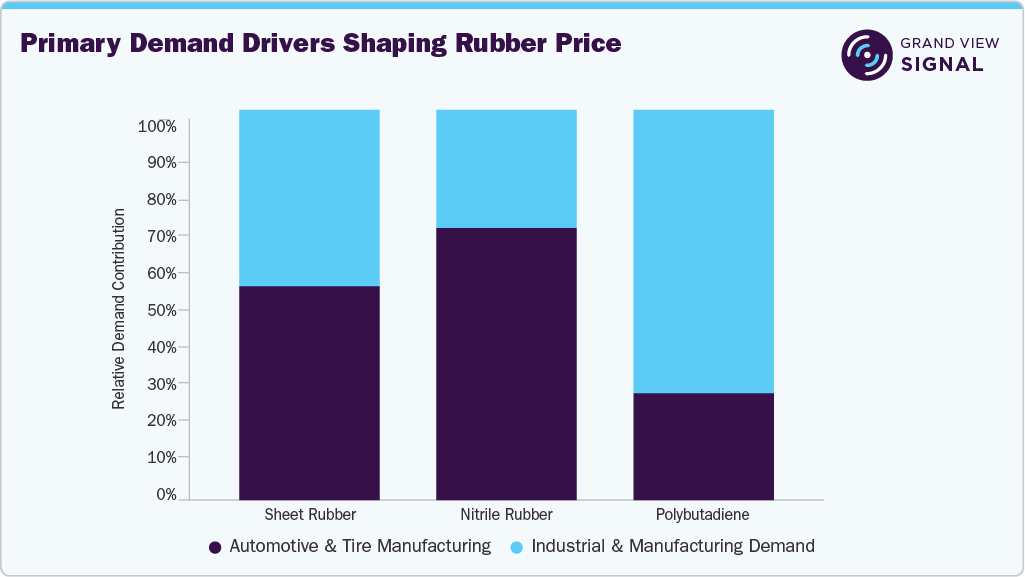
  • Diversified Demand Base: Unlike BR, which is heavily tied to tire manufacturing, NBR demand was supported by a broader range of industrial applications requiring oil- and fuel-resistance, including automotive seals, hoses, industrial gaskets, rollers, cable products, and specialized footwear.
  • Replenishment-Led Stability: While industrial end-users maintained conservative purchasing strategies due to uneven manufacturing conditions, consistent replenishment across diversified end-use sectors allowed NBR to maintain a comparatively firm and stable price position near month-end.
  • Real-World Impact: Industrial seal and gasket suppliers serving the oil and gas and industrial machinery sectors benefited from stable end-use demand for NBR. Unlike tire producers operating on thin-spot margins, specialty industrial fabricators maintained steady operating rates due to predictable replacement cycles.

Transforming Rubber Commodity Intelligence with Grand View Signal

Grand View Signal empowers category managers to bridge the gap between reactive spot buying and predictive risk management through a unified SaaS commodity price intelligence tool. By combining high-frequency pricing assessments across natural rubber grades (such as Indian RSS3 and U.S. RSS3) with real-time upstream monomer tracking for Butadiene and Styrene, Signal isolates true feedstock shifts from supplier surcharges. This enables procurement teams to audit vendor quotes against actual market trajectories, identify material substitution arbitrage opportunities, and structure resilient, index-linked supply contracts before market spikes erode gross margins.

In an environment marked by weather anomalies, volatile petrochemical feedstocks, and diverging regional demand, relying on static annual RFPs or lagging monthly averages is an operational liability. Long-term category performance now belongs to supply chain leaders who replace reactive purchasing habits with continuous, data-driven market visibility. By leveraging predictive pricing intelligence to anticipate structural shifts across natural and synthetic markets, forward-thinking procurement teams can transform rubber volatility into a sustainable competitive advantage.

Read our latest articles on

Tuesday, August 18, 2026

Rubber Price Trends in 2026: Key Market Developments and Outlook

Rubber Pricing Intelligence - Executive Summary

Rubber pricing intelligence covers natural rubber (RSS3) and synthetic rubber. Rubber markets recorded mixed movement during July 2026, with natural rubber strengthening in the first half before weakening toward month-end as buyers completed immediate requirements, while Indian domestic sheet-rubber prices remained firm and Bangkok RSS3 and China’s monitored natural-rubber prices softened after mid-month recovery. Synthetic rubber saw a stronger mid-month recovery, with BR rebounding sharply during July 11–20 after early declines before losing momentum, while NBR recovered steadily and remained comparatively firm near month-end. Demand stayed uneven across tire and industrial-rubber sectors, with replacement tires performing better than original-equipment demand and automotive, footwear, hoses, seals, and belts supporting selective procurement, while European trade-policy changes and tighter UK waste-tire export controls heightened the importance of regional supply, compliance, and traceability.

Primary Demand Drivers Shaping Rubber Price, July 2026

Key Price Developments & Insights

  • Natural rubber strengthened in early July before correcting as restocking eased and buyers shifted to requirement-based procurement.
  • BR weakened early, recovered sharply mid-month, then moderated toward month-end.
  • NBR declined initially before steadily recovering in the second half of July.
  • Indian sheet-rubber prices remained firm, while international RSS3 values eased, reflecting divergent domestic and global market conditions.
  • European tire trade conditions shifted following anti-dumping duties on passenger-car and light-lorry tires imported from China.

Top Performing Rubber Commodity

  • Top Mover: Acrylonitrile Butadiene Rubber (NBR)
  • Average MoM Growth (top 3 geographies): 1.0%
  • Volatility Level: Stable

Schedule a free demo of Grand View Signal to get real-time preview of price fluctuations in the Rubber Sector

Rubber Sector Coverage and Key Price Influencers

1. Natural Rubber

The Natural Rubber category covers RSS3 sheet rubber, widely used in tires, automotive components, conveyor belts, footwear, and technical rubber products. July pricing reflected variations in physical availability, procurement patterns, inventories, and tire-sector demand.

Key Pricing Influencers:

  • Weather and tapping conditions in producing countries
  • Tire and automotive demand
  • Physical inventories and export availability
  • Currency, freight and regional import economics

2. Synthetic Rubber

The Synthetic Rubber category covers BR and NBR, used in tires, footwear, seals, hoses, gaskets, cables, and other industrial applications. July price movements reflected differing purchasing patterns across tire and industrial-rubber markets.

Key Pricing Influencers:

  • Butadiene and acrylonitrile replacement costs
  • Tire and automotive-component production
  • Footwear and industrial-rubber demand
  • Producer availability, inventories and import conditions

Get historical, current, and forecast rubber price assessments. Request Free Access to Grand View Signal

Pricing Trends, July 2026

  • Natural Rubber

Natural rubber prices recovered in early and mid-July before weakening toward month-end, with China’s standard-rubber price declining during 1–10 July, recovering modestly during 11–20 July, and then softening as buying urgency remained limited. Regional markets diverged, as Indian RSS4 and RSS5 prices stayed firm while Bangkok RSS3 declined, reflecting tighter Indian domestic availability and differing procurement, inventory, currency, and replacement-tire conditions across regions.

  • Synthetic Rubber

Synthetic rubber recorded a stronger mid-July recovery than natural rubber, with Chinese BR9000 prices declining early, rising sharply during 11–20 July on immediate restocking needs after June’s weakness, and easing in the final week as processors avoided large inventories. NBR followed a steadier recovery, weakening initially before strengthening through the second half and stabilizing near late-July highs, supported by diverse demand across seals, hoses, gaskets, footwear, cables, and other industrial applications, while purchases remained tied to confirmed downstream orders.

Access commodity-wise monthly forecast datasets for the next 6 months. Request Free Access to Grand View Signal

Rubber Key Market Drivers

  • Regional natural-rubber availability and controlled procurement: China’s rubber market recovered modestly mid-month before correcting, while Indian RSS prices remained firm and Bangkok RSS3 declined, reflecting regional supply, demand, currency, and import conditions. Buyers focused on immediate needs, limiting restocking and late-July gains.
  • Sharp mid-month BR recovery: BR prices fell early July before rebounding sharply during 11–20 July as buyers covered short-term needs after June’s weakness. Cautious downstream demand limited inventory building, causing prices to moderate toward month-end.
  • Gradual NBR recovery and application-specific demand: NBR weakened initially before recovering steadily and stabilizing near month-end, supported by demand from automotive, industrial, footwear, cable, and other applications. Purchasing remained focused on confirmed requirements amid uneven manufacturing demand.
  • Uneven replacement and original-equipment demand: Replacement-tire demand remained more resilient than original-equipment demand in several markets, while higher manufacturing, logistics, and customs costs encouraged disciplined inventory management and limited uniform growth in rubber consumption.
  • Trade defense, traceability, and regional supply chains: EU anti-dumping duties on Chinese passenger-car and light-lorry tires and new UK waste-export reporting requirements increased focus on regional sourcing, compliance, traceability, and recycling economics, influencing longer-term rubber demand and supply chains.

Get detailed driver impact analysis on rubber prices. Request Free Access to Grand View Signal

Grand View Signal offers

Grand View Signal tracks 200 commodities across multi-countries and reconstructs the price history back to 2016. This way, decision-makers can see not just what a material costs, but the drivers impacting the same. The offering includes commodity price capture across 8 sectors.

  • Weekly Commodity Pulse - What changed across commodity markets this week - the panoramic view, in five minutes.
  • Why Prices Moved - A single commodity, taken apart. Every driver, ranked, with the causal chain traced.
  • Risk Watch - What could disrupt supply in the next four to eight weeks, with exposure graded.
  • Decision Brief - The stance, the triggers that would change it, and the six-month forecast.

Explore Grand View Signal and access the full commodity price database and analyst forecasts.

Read our latest article on how Grand View Signal can assist procurement team with EU PPWR compliance