
As the bedrock of global food security, mineral fertilizers are vital to modern agricultural productivity, directly dictating crop yields and farm economics across the globe. However, because fertilizer manufacturing depends heavily on concentrated energy sources and key mineral deposits, the industry remains exceptionally susceptible to geopolitical disruptions. Recent tensions involving Iran—a crucial urea exporter and major regional energy provider—have severely hampered shipping lanes through the Strait of Hormuz, inflating marine insurance premiums and squeezing global nitrogen and raw material supplies. In contrast, the wider seaborne urea market strengthened as constrained Middle Eastern exports, higher European production costs and renewed importer activity tightened internationally available supply.
Against this turbulent macroeconomic background, specialty and high-analysis inputs have undergone swift strategic shifts. Notably, ammonium biphosphate MAP in the U.S. recorded an extraordinary 46.4% year-over-year growth as buyers aggressively secured concentrated, dependable phosphate supplies to buffer against unpredictable input pricing.
To handle these volatile commodity shifts, industry executives rely on Grand View Signal, a SaaS platform providing real-time pricing intelligence, trade flow monitoring, and predictive market analytics to refine global procurement and risk strategies.
China’s Quiet Market vs. Surging Global Prices
China’s domestic urea sector remained muted throughout July, with local production easily covering immediate spot requirements. Conversely, international nitrogen markets headed in the opposite direction, propelled by shrinking seaborne availability and escalating ocean freight charges.
This regional divergence holds major implications for global agriculture. Nitrogen represents the largest fertilizer category by volume globally, with just three primary crops driving over 50% of total consumption: corn/maize (20%), wheat (18%), and rice (16%). Because fertilizer historically claims a massive share of total crop input expenses—averaging 21% for corn and 19% for wheat—even minor fluctuations in delivered nitrogen costs directly alter farm profitability.
When seaborne replacement values escalate, import-reliant regions must absorb higher freight rates, increased insurance surcharges, and markups from alternative suppliers. For growers already facing unpredictable grain markets, these compounding input costs quickly shrink profit margins, making disciplined buying strategies vital for curbing supply chain risks.
Schedule a free demo of Grand View Signal to get real-time preview of price fluctuations in the Fertilizers Sector
How Shipping Bottlenecks and Energy Costs Impacted Middle Eastern Supply
The Middle East remains a vital exporter of urea, ammonia, and foundational fertilizer ingredients. Consequently, regional supply disruptions quickly affected global availability, contributing to a month-over-month decline of 1.4%.
- Ammonia Export Limits: Reduced outbound shipments from the Middle East elevated international replacement costs across multiple nitrogen products.
- Elevated Energy Costs: Spiking European natural gas prices pushed up the baseline manufacturing expense of nitrogen fertilizers across Western Europe.
- Logistical Obstacles: UAE-based manufacturers faced shipping and logistics bottlenecks, though their geographically diversified operations helped prevent widespread contract cancellations.
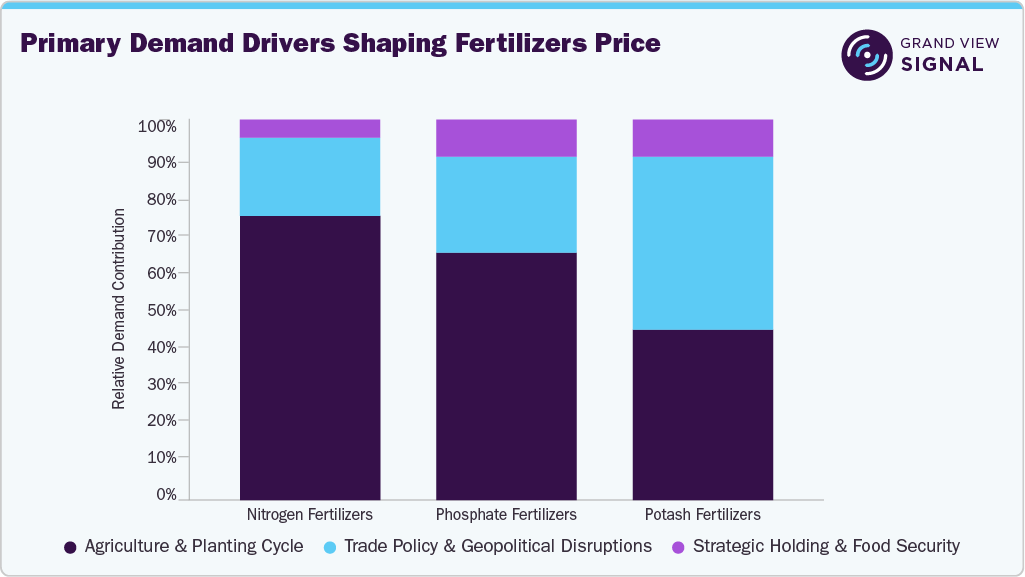
In response to these conditions, global buyers adapted by broadening their supplier networks and building larger inventory cushions where financially feasible. Nitrogen and phosphate products felt these pressures most intensely, whereas potash remained largely insulated from natural gas price volatility.
Get historical, current, and forecast fertilizers price assessments. Request Free Access to Grand View Signal
India’s Strategic Balance During the Kharif Season
India’s farming sector generated substantial demand in July driven by active Kharif crop planting. Farmers steadily applied urea, phosphate, and potash across major agricultural regions. To maintain local price stability and avoid panic buying, the Indian government closely managed its national reserves.
A combination of robust domestic production, international urea import tenders, structured monthly distribution, and existing long-term import contracts kept local supply comfortably ahead of agricultural demand. Government authorities actively tracked inter-state movement to reroute fertilizers wherever field applications peaked. Through this controlled inventory management, India supported steady global trade volumes without triggering sudden buying sprees that could have inflated international market prices.
Access commodity-wise monthly forecast datasets for the next 6 months. Request Free Access to Grand View Signal
Phosphate Supply Bottlenecks and Strategic Coalitions
Phosphate fertilizers remained vulnerable to raw material bottlenecks throughout July, particularly concerning sulfur, ammonia, phosphate rock, and phosphoric acid access. Disruptions along Middle Eastern transport routes heightened shipping risks and import costs for raw materials. Simultaneously, strict export limitations on Chinese phosphate restricted options for international buyers.
While monoammonium phosphate (MAP) prices within China held firm, this internal stability failed to mirror the higher replacement expenses borne by overseas buyers. Fertilizer producers featuring fully integrated phosphate rock assets maintained a distinct edge, particularly those capable of securing alternative sulfur and ammonia supply lines.
On a broader scale, Morocco expanded a major phosphate alliance in July to reinforce long-term global output capacity. Koch Ag & Energy Solutions alongside OCP Nutricrops finalized an agreement allowing Koch to buy a 50% stake in Jorf Fertilizers Company I (JFC I). This 50-50 joint venture in Morocco will fortify global supply chains while expanding phosphate fertilizer availability, especially for North American producers.
Get detailed driver impact analysis on Fertilizers Prices. Request Free Access to Grand View Signal
Why Potash Maintained Stability Despite Global Volatility
In contrast to the turbulent nitrogen sector, potash markets enjoyed a far calmer month. In India, muriate of potash (MOP) stockpiles comfortably surpassed seasonal requirements, recording a 7.6% year-over-year increase and eliminating any need for emergency spot purchases. China’s monitored potassium sector similarly reflected minimal price movement, verifying that supply was sufficient to satisfy current demand.
Agricultural buyers maintained deliberate timing on potash purchases based on crop economics, existing reserves, and scheduled field application windows. Meanwhile, specialized formulations such as sulfate of potash (SOP) and potassium nitrate followed smaller, targeted purchasing cycles tailored to high-value, chloride-sensitive crops. Although elevated freight charges increased delivered costs, healthy inventory levels and patient buying habits kept domestic potash prices steady through the month.
Make Better Commodity Decisions with Signal
Navigating shifting fertilizer costs, trade restrictions, and supply disruptions demands reliable market intelligence. Grand View Signal equips industry leaders with clarity across global agricultural inputs via tailored research and analytical tools.
Grand View Signal’s primary features include:
- Real-Time Price Benchmarking: Detailed price tracking across major global fertilizer trading hubs to monitor replacement costs and market trends.
- Global Trade Flow Tracking: Continuous monitoring of ocean freight rates, shipping vessel movements, and regional supply bottlenecks.
- Custom Supply & Demand Analytics: Predictive forecasting tools for nitrogen, phosphate, and potash markets.
- Policy and Export Tracking: Up-to-date analysis covering trade policies, government procurement tenders, and global export limits.
- Strategic Advisory Services: Customized consulting support for manufacturers, traders, and institutional investors managing commodity exposure.
