Pages

Friday, August 29, 2025

Lithium Market 2030: Carbonates Powering the Future

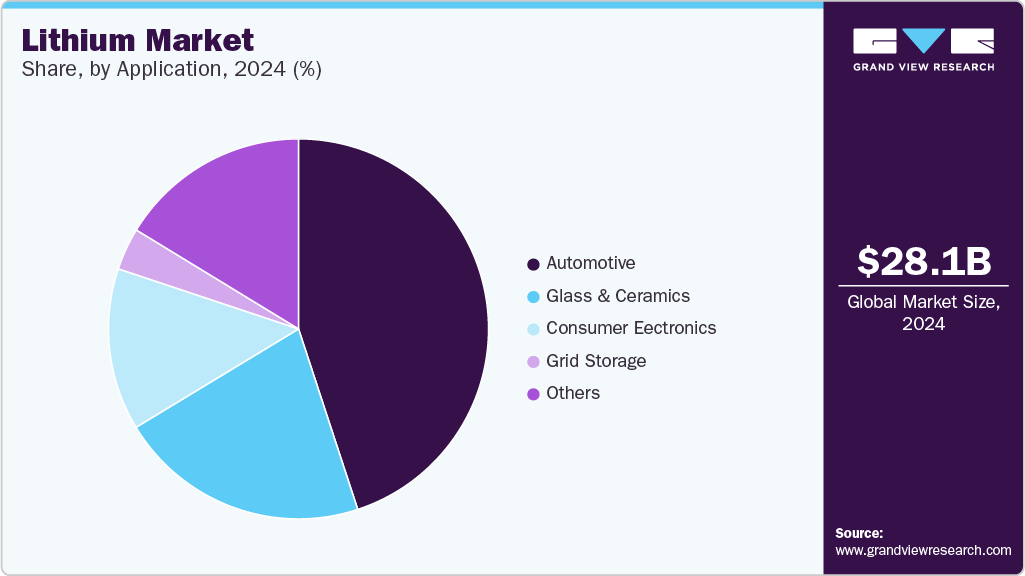
The global lithium market was valued at USD 28.08 billion in 2024 and is projected to reach USD 74.81 billion by 2030, growing at a CAGR of 18.2% from 2025 to 2030. This robust growth is primarily driven by the accelerating shift toward vehicle electrification, which is expected to generate substantial demand for lithium-ion batteries over the forecast period.

The automotive application segment is set to experience strong growth, fueled by increasingly stringent government regulations aimed at reducing carbon dioxide emissions from internal combustion engine (ICE) vehicles. In response, global automakers are investing heavily in electric vehicle (EV) production, which is directly increasing the demand for lithium and its derivatives.

Lithium Market, By Application, 2024 (%)

In addition, government subsidies for EVs and growing investments in battery manufacturing are expected to further support lithium market expansion. The United States plays a significant role in global battery production—second only to China—making it one of the largest consumers of lithium globally.

As of 2024, the U.S. holds substantial lithium resources, estimated at between 14 million and 20–40 million metric tons, depending on evolving geological data. However, actual domestic lithium production remains limited. In 2024, the U.S. produced approximately 610 metric tons, accounting for just 0.3% of global output—far short of meeting its growing domestic demand, particularly from the EV sector.

Order a free sample PDF of the Lithium Market Intelligence Study, published by Grand View Research.

Key Market Trends & Insights

  • Asia Pacific dominated the global lithium market in 2024, accounting for over 47% of total revenue. This leadership is driven by the region’s rapidly growing automotive, electronics, glass, and consumer goods industries—particularly in China, Japan, and South Korea. The region is expected to maintain its dominance and record the fastest CAGR in volume during the forecast period.
  • By Application: The consumer electronics segment is anticipated to register the fastest revenue CAGR, exceeding 27.6% between 2025 and 2030. Rising global demand for electronic devices—such as smartphones, laptops, cameras, speakers, and portable radios—continues to drive lithium usage in this segment.
  • By Product: The lithium carbonates segment is projected to grow at a notable CAGR in revenue terms from 2025 to 2030. Lithium carbonate (Li₂CO₃) is a key compound used in producing lithium hydroxide and pure lithium metal, and also plays a role in pharmaceutical applications, such as treating bipolar disorder.

Market Size & Forecast

  • 2024 Market Size: USD 28.08 billion
  • 2030 Projected Market Size: USD 74.81 billion
  • CAGR (2025-2030): 18.2%
  • Asia Pacific: Largest market in 2024

Key Companies & Market Share Insights

Several major players are shaping the global lithium market through production, innovation, and strategic expansion. Key companies include Albemarle, Ganfeng Lithium Co., Ltd., and Mineral Resources.

  • Albemarle Corporation - Albemarle’s lithium segment develops lithium-based materials for a range of industries. The company manufactures lithium carbonate, hydroxide, chloride, and other specialized reagents such as butyllithium and lithium aluminum hydride. Albemarle also provides technical services, including support for handling reactive lithium products and recycling lithium-containing by-products.
  • Ganfeng Lithium Co., Ltd. - Ganfeng serves various sectors, including EVs, energy storage, pharmaceuticals, chemicals, and 3C (Computer, Communication, and Consumer Electronics). The company has the capability to extract lithium from ore, brine, and recycled materials, offering more than 40 lithium and related metal compounds—making it one of the most diversified suppliers in the market.

Key Players

  • Albemarle Corp.
  • Ganfeng Lithium Co., Ltd.
  • SQM S.A.
  • Tianqi Lithium Corporation
  • Livent Corp.
  • Lithium Americas Corp.
  • Pilbara Minerals
  • Orocobre Limited
  • Mineral Resources Group Co., Ltd.

Explore Horizon Databook – The world's most expansive market intelligence platform developed by Grand View Research.

Conclusion

The global lithium market is entering a high-growth phase, driven by the rapid expansion of electric vehicles, increasing adoption of consumer electronics, and rising demand for energy storage solutions. With a projected CAGR of 18.2% through 2030, the market is set to nearly triple in value. While Asia Pacific will continue to lead in both production and consumption, countries like the United States are actively working to enhance domestic lithium supply through government-backed investments and innovation. The ongoing integration of lithium into critical sectors—including automotive, electronics, and pharmaceuticals—will continue to drive market expansion, positioning lithium as a cornerstone of the global clean energy transition.

Industrial Software Market 2030: MES Leads the Charge

The global industrial software market was valued at USD 20.35 billion in 2023 and is projected to reach USD 60.91 billion by 2030, expanding at a CAGR of 16.8% from 2024 to 2030. This significant growth is driven by the widespread adoption of automation and digital transformation initiatives across various industries, as companies aim to enhance operational efficiency, reduce costs, and improve product quality.

The rapid advancement of Industry 4.0 technologies, such as the Industrial Internet of Things (IIoT), artificial intelligence (AI), and machine learning (ML), is further accelerating demand for sophisticated software tools. These technologies enable organizations to analyze large datasets, optimize production workflows, and anticipate maintenance needs, resulting in smarter and more efficient industrial operations.

Industrial software market size by region, and growth forecast (2024-2030)

The rise of cloud computing and the transition to Software-as-a-Service (SaaS) models are also broadening access to industrial software, especially for small and medium-sized enterprises (SMEs). These models reduce upfront infrastructure costs and provide scalable, flexible solutions that meet evolving business needs.

The integration of core industrial software systems—such as Supervisory Control and Data Acquisition (SCADA), robotic software, and Manufacturing Execution Systems (MES)—with enterprise platforms like Product Lifecycle Management (PLM) and Enterprise Resource Planning (ERP) is opening up new growth opportunities. These integrations enable seamless communication and data flow across business functions, enhancing real-time decision-making and resource optimization.

Order a free sample PDF of the Industrial Software Market Intelligence Study, published by Grand View Research.

Key Market Trends & Insights

  • North America held the largest market share in 2023, accounting for 33.96% of global revenue. The region’s leadership in advanced manufacturing sectors—such as aerospace, automotive, and electronics—has driven high adoption rates of industrial software aimed at boosting operational performance. Additionally, strong investments in digital transformation and Industry 4.0 technologies continue to reinforce the region’s dominance.
  • By End-Use: The process industries segment led the market in 2023, contributing the highest revenue share. Sectors such as oil & gas, pharmaceuticals, chemicals, and food & beverages rely on precise monitoring and control of complex operations, making industrial software essential for maintaining safety, efficiency, and compliance.
  • By Type: The Manufacturing Execution System (MES) segment was the largest in 2023, accounting for 28.22% of global revenue. MES platforms enable real-time monitoring, control, and optimization of production processes, leading to enhanced product quality and regulatory compliance. As smart manufacturing and digitalization continue to evolve, the demand for MES is expected to increase steadily.

Market Size & Forecast

  • 2023 Market Size: USD 20.35 Billion
  • 2030 Projected Market Size: USD 60.91 Billion
  • CAGR (2024-2030): 16.8%
  • North America: Largest market in 2023

Key Companies & Market Share Insights

Leading players in the industrial software market include ABB, Rockwell Automation, and Emerson Electric Co. These companies are actively pursuing strategies such as partnerships, mergers & acquisitions, and product innovations to strengthen their market position and expand their customer base.

  • In May 2024, Forterro, a specialized software provider, launched Fortee in the UK—an entry-level, cloud-based ERP solution designed for industrial startups and SME discrete manufacturers. Built on 15 years of experience in cloud ERP, Fortee incorporates extensive insights to deliver a tailored, scalable solution that supports operational agility and digital growth.

Key Players

  • ABB
  • Rockwell Automation
  • Emerson Electric Co.
  • General Electric Company
  • Honeywell International, Inc.
  • SAP SE
  • OMRON Corporation
  • Hexagon AB
  • Siemens
  • Oracle

Explore Horizon Databook – The world's most expansive market intelligence platform developed by Grand View Research.

Conclusion

The industrial software market is experiencing rapid transformation, fueled by accelerating automation, the rise of Industry 4.0, and increasing demand for integrated digital solutions. With a projected CAGR of 16.8% through 2030, the market is set to triple in size. As manufacturers across sectors aim to boost efficiency, agility, and innovation, industrial software will play a central role in shaping the future of smart, connected enterprises. The continued expansion of cloud-based platforms and the integration of MES, ERP, and PLM systems are key to enabling this evolution, particularly for SMEs seeking scalable digital solutions.

Industrial Absorbents Market 2033: Innovations Shaping the Future of Spill Control

The global industrial absorbents market was valued at USD 4,426.5 million in 2024 and is projected to reach USD 6,568.4 million by 2033, growing at a CAGR of 4.6% from 2025 to 2033. This growth is primarily driven by the widespread use of industrial absorbents designed to contain and clean up leaks, drips, and spills, ensuring cleaner, safer, and regulation-compliant work environments across industries.

Industrial absorbents are a key component of spill response kits, allowing for immediate containment and cleanup of hazardous materials. The demand is further fueled by the growth of manufacturing and industrial operations, where the use of chemicals and hazardous substances increases the likelihood of spills. As a result, industries are turning to advanced absorbents and customized spill solutions to meet both operational needs and environmental regulations.

Industrial absorbents market size and growth forecast (2023-2033

The market is also seeing growing interest in cellulose-based absorbents, which are biodegradable, eco-friendly, and offer high absorption efficiency. These sustainable alternatives are gaining traction over synthetic options. Meanwhile, composite absorbents—known for their robust structural integrity and performance across a range of pH levels, temperatures, and salt solutions—are being increasingly adopted in forestry, biomedical, and environmental protection applications.

With rising industrial activity, particularly in the Asia Pacific region, and tightening environmental regulations, industries such as oil & gas, chemicals, and manufacturing are showing greater interest in sustainable, high-performance absorbent solutions.

Order a free sample PDF of the Industrial Absorbents Market Intelligence Study, published by Grand View Research.

Key Market Trends & Insights

  • Asia Pacific led the global industrial absorbents market in 2024, accounting for 39.9% of total revenue. The region’s growth is supported by increasing oil production, expanding refining capacities, and stricter environmental policies. Countries like China, India, and those in Southeast Asia are driving demand for chemical and oil-only absorbents to manage industrial spills and ensure operational safety.
  • By Material: Synthetic polymer-based absorbents dominated the market in 2024, with a 64.2% share. These materials are particularly valuable in the pharmaceutical industry, especially for use in advanced wound care products. Their ability to support controlled drug release enhances therapeutic outcomes and patient comfort.
  • By Product: Pads and rolls led the market in 2024 with a 43.1% share. Known for being lightweight and dust-free, these polypropylene-based products are designed to absorb aggressive chemicals like acids and alkalis, offering quick cleanup and improving workplace safety.
  • By Absorbent Type: The universal absorbents segment held the largest share of 52.5% in 2024. Their ability to absorb a wide variety of liquids—including oils, solvents, coolants, and water-based fluids—makes them ideal for general industrial use and routine maintenance.
  • By Absorbency Capacity: Medium absorbency products led the market with 51.5% share in 2024. Widely used in pads, pillows, and rolls, these offer a balance of performance and cost-effectiveness, making them suitable for handling moderate spill volumes.
  • By End Use: The oil and gas sector dominated end-use applications in 2024, accounting for 28.3% of the market. The sector relies heavily on oil-only absorbents to manage hydrocarbon spills during drilling, refining, and transport, while repelling water for targeted cleanup.

Market Size & Forecast

  • 2024 Market Size: USD 4,426.5 Million
  • 2033 Projected Market Size: USD 6,568.4 Million
  • CAGR (2025 - 2033): 4.6%
  • Asia Pacific: Largest market in 2024

Key Companies & Market Share Insights

Leading companies in the industrial absorbents market include Johnson Matthey and Meltblown Technologies Inc., among others.

  • Johnson Matthey - Headquartered in London, UK, Johnson Matthey is a global leader in advanced materials and catalysts. The company specializes in high-performance sorbents and catalytic materials that support emission control and clean technologies. With over 200 years of innovation, Johnson Matthey delivers reliable solutions for industrial safety and sustainability, meeting stringent regulatory standards and enabling cleaner operations across sectors.
  • Meltblown Technologies Inc. - Based in Georgia, U.S., Meltblown Technologies is an emerging player in the market, focused on developing advanced melt-blown fabric materials. Their products offer exceptional fluid retention, filtration, and durability, serving applications in industrial, environmental, and healthcare settings. Through research partnerships and continuous innovation, the company aims to lead the way in next-generation absorbent technologies that enhance safety and sustainability.

Key Players

  • 3M
  • New Pig Corporation
  • Oil Dri Corporation of America
  • Brady Worldwide, Inc.
  • Johnson Matthey
  • Tolsa S.A.
  • Ansell Ltd.
  • Meltblown Technologies Inc.

Explore Horizon Databook – The world's most expansive market intelligence platform developed by Grand View Research.

Conclusion

The global industrial absorbents market is on a steady growth path, driven by the expanding industrial landscape, rising environmental regulations, and the increasing need for effective and sustainable spill management solutions. With a projected CAGR of 4.6% through 2033, the market will continue evolving to meet industry demands for eco-friendly materials, regulatory compliance, and workplace safety. Regions like Asia Pacific and sectors such as oil & gas are expected to remain central to this growth, while innovation in materials and product design will shape the future of industrial absorbents worldwide.

Impact Investing Market: Unpacking the Future of Sustainable Finance

The global impact investing market was valued at USD 87.53 billion in 2024 and is expected to reach USD 253.95 billion by 2030, growing at a CAGR of 20.0% between 2025 and 2030. This rapid expansion is driven by several key factors that continue to shape the landscape of sustainable and socially responsible investments.

A primary driver behind this growth is the rising demand from investors who seek to align their capital with their personal values, aiming to generate both financial returns and positive social or environmental outcomes. There is a growing awareness among investors of pressing global challenges, prompting a shift toward investment strategies that directly address these issues.

Impact Investing Market Share

Another contributing factor is the increasing recognition that impact investments can deliver strong financial performance. Historically viewed as a trade-off between returns and social good, impact investing is now seen as a means to achieve both. With more data emerging on successful impact strategies and fund performance, investor confidence in the sector continues to grow.

In addition, government policies and regulatory frameworks are playing a significant role in fostering industry growth. Policymakers across the globe are introducing tax incentives, grants, and subsidies to encourage sustainable investment. Moreover, the integration of Environmental, Social, and Governance (ESG) standards into regulatory systems creates a favorable environment for the expansion of impact investing.

Order a free sample PDF of the Impact Investing Market Intelligence Study, published by Grand View Research.

Key Market Trends & Insights

  • Regional Insights: In 2024, North America held a significant market share, driven by a surge in demand from institutional investors looking to align financial outcomes with social and environmental objectives. Pension funds, endowments, and other institutions are increasingly adopting ESG criteria in their investment strategies.
  • By Asset Class: The equity segment led the market in 2024, accounting for 48.3% of total investments. Equity provides investors with ownership in companies actively addressing global challenges, allowing for direct involvement in driving positive change.
  • By Offering: Equity also dominated market offerings in 2024. The segment offers a wide range of opportunities, from established funds to early-stage venture capital in socially impactful startups, allowing investors to support businesses that reflect their values.
  • By Investment Style: The active investing segment led in 2024. This approach allows investors to engage directly with companies or projects, aligning closely with the mission of impact investors who seek to create measurable change.
  • By Investor Type: Institutional investors dominated the market in 2024. Increased interest from organizations such as pension funds and endowments has been a key growth driver, as they recognize the strategic importance of incorporating ESG factors into investment decisions.

Market Size & Forecast

  • 2024 Market Size: USD 87.53 Billion
  • 2030 Projected Market Size: USD 253.95 Billion
  • CAGR (2025-2030): 20.0%
  • North America: Largest market in 2024
  • Asia Pacific: Fastest growing market

Key Companies & Market Share Insights

Leading companies in the global impact investing market include BlackRock, Inc., Goldman Sachs, Bain Capital LP, Morgan Stanley, and Prudential Financial, Inc. These players are focused on expanding their market presence through strategic initiatives such as partnerships, mergers, and acquisitions.

  • BlackRock, Inc. - A global leader in investment management, BlackRock offers a range of financial and technology solutions, including mutual funds, ETFs, and alternative investments. It integrates ESG considerations across its investment process and actively engages with portfolio companies on issues like climate change and corporate governance.
  • Bain Capital LP - Operating across North America, Europe, and Asia, Bain Capital manages over USD 175 billion in assets. The firm invests across multiple sectors, including healthcare, technology, and financial services. Its Double Impact initiative emphasizes investments that deliver both financial and measurable social returns.

Key Players

  • BlackRock, Inc.
  • Goldman Sachs
  • Bain Capital LP
  • Morgan Stanley
  • Vital Capital
  • Prudential Financial, Inc.
  • BlueOrchard Finance Ltd.
  • Manulife Investment Management Holdings (Canada) Inc.
  • Leapfrog Investments
  • Community Investment Management LLC

Explore Horizon Databook – The world's most expansive market intelligence platform developed by Grand View Research.

Conclusion

The global impact investing market is witnessing transformative growth, underpinned by strong investor interest, credible financial performance, and supportive regulatory environments. With a projected CAGR of 20.0% through 2030, the sector is poised to become a mainstream component of global investment portfolios. As institutions and individuals increasingly align their capital with purpose-driven goals, impact investing will play a critical role in addressing global challenges while delivering competitive financial returns.

U.S. Viral Vector And Plasmid DNA Manufacturing Market: A Deep Dive into Growth Trends

The U.S. viral vector and plasmid DNA manufacturing market was valued at USD 2.2 billion in 2023 and is forecasted to reach USD 8.0 billion by 2030, growing at a CAGR of 20.0% from 2024 to 2030. This growth is driven by the increasing involvement of companies in gene and cell therapy research and development, supported by a significant number of contract development organizations (CDOs) operating in the U.S. Additionally, domestic firms are expanding their manufacturing capabilities within the country.

U.S. Viral Vector And Plasmid DNA Manufacturing Market share and size, 2023

In 2023, the U.S. held a 42.0% share of the global viral vector and plasmid DNA manufacturing market. Growth is further fueled by rising government investments and the increasing prevalence of targeted diseases. For instance, according to the Spinal Muscular Atrophy Foundation in 2020, approximately 10,000 to 25,000 adults and children in the U.S. were affected by spinal muscular atrophy, highlighting the demand for gene therapy in treating rare diseases.

The market for cell and gene therapy manufacturing is highly competitive due to numerous contract manufacturers and research organizations. New entrants and facility expansions by existing players have intensified competition within the U.S. Thermo Fisher Scientific, Inc. and Lonza are prominent market participants, employing various strategies to strengthen their positions. For example, in July 2021, Thermo Fisher Scientific announced the opening of a new current Good Manufacturing Practice (cGMP) viral vector and plasmid DNA production facility in Carlsbad, California, aimed at meeting growing demand for mRNA-based vaccines and plasmid DNA therapies.

Order a free sample PDF of the U.S. Viral Vector And Plasmid DNA Manufacturing Market Intelligence Study, published by Grand View Research.

Key Market Trends & Insights

  • By vector type, the adeno-associated virus (AAV) segment led the market in 2023, capturing the largest revenue share of 19.8%. The segment’s growth is supported by effective vector recovery and clarification processes, which commonly use centrifugation or Tangential-Flow Filtration (TFF) followed by alkaline or heat lysis methods to extract plasmid DNA (pDNA) from biomass.
  • By workflow, downstream processing dominated the market with a 53.3% revenue share in 2023. This phase involves multiple purification steps categorized into capture, intermediate purification, and polishing. Techniques such as chromatography and ultrafiltration are widely used during intermediate purification and polishing.
  • By application, vaccinology accounted for the largest revenue share of 22.0% in 2023. The strong demand for vaccines addressing various health conditions and cancers is expected to continue propelling market growth. The cell therapy segment is projected to grow at the fastest CAGR due to the increasing adoption of next-generation transfer vectors.
  • By end use, research institutes dominated the market in 2023, holding 58.0% of revenue share. This dominance reflects the high demand for vectors to support research activities and the growing participation of scientific communities in gene and cell therapy studies.
  • By disease, cancer led the market with a 38.0% revenue share in 2023. Market growth in this segment is attributed to the expanding use of vectors in developing cancer therapies, a growing number of research programs, and recent approvals of gene therapy products.

Market Size & Forecast

  • 2023 Market Size: USD 2.2 Billion
  • 2030 Projected Market Size: USD 8.0 Billion
  • CAGR (2024-2030): 20.0%

Key Companies & Market Share Insights

Leading players in the U.S. viral vector and plasmid DNA manufacturing market include Thermo Fisher Scientific, Inc., Catalent Inc., and Waisman Biomanufacturing.

  • Thermo Fisher Scientific, Inc. produces laboratory reagents, equipment, analytical instruments, consumables, and diagnostic products. The company operates under multiple brands such as Thermo Scientific, Applied Biosystems, Fisher Scientific, Invitrogen, and Unity Lab Services. It is structured into four main segments: analytical instruments, life sciences solutions, specialty diagnostics, and laboratory products & services.
  • Catalent, Inc. offers innovative manufacturing services to pharmaceutical companies globally. Operating across five continents with 30 facilities worldwide, Catalent’s services include manufacturing and packaging a variety of injectable, oral, and respiratory dosage forms. The company delivers over 70 billion doses for more than 7,000 products.

Key Players

  • Thermo Fisher Scientific, Inc.
  • Catalent Inc.
  • Waisman Biomanufacturing
  • Genezen
  • Revvity (SIRION Biotech)
  • Virovek Incorporation
  • Charles River Laboratories (Cobra Biologics)
  • RegenxBio, Inc.

Explore Horizon Databook – The world's most expansive market intelligence platform developed by Grand View Research.

Conclusion

The U.S. viral vector and plasmid DNA manufacturing market is set for rapid growth, driven by robust research activity in gene and cell therapies, expanding contract development organizations, and increased government funding. The dominance of key players such as Thermo Fisher Scientific and Catalent, along with advancements in manufacturing technologies and the rising prevalence of diseases like cancer and spinal muscular atrophy, underpin the market’s positive outlook. The increasing demand for advanced therapies and vaccines will continue to fuel market expansion through 2030, positioning the U.S. as a critical hub in global viral vector and plasmid DNA manufacturing.

U.S. Test & Measurement Equipment Market: Navigating Future Innovations

The U.S. test and measurement equipment market was valued at USD 8.27 billion in 2024 and is expected to grow to USD 10.96 billion by 2030, reflecting a CAGR of 5.0% from 2025 to 2030. This expansion is primarily driven by the essential role these instruments play across various industries. Increasingly complex electronic devices and systems in sectors such as automotive, telecommunications, and aerospace require precise testing to ensure performance and compliance. Additionally, emerging technologies like the Internet of Things (IoT), 5G, and artificial intelligence (AI) have further heightened the demand for sophisticated test and measurement solutions. The rising emphasis on quality assurance and predictive maintenance also supports this growth trajectory.

U.S. test & measurement equipment market size and growth forecast (2020 - 2030)

The U.S. test and measurement equipment market is propelled by several key trends. The rapid rollout of 5G infrastructure nationwide has intensified demand for advanced testing tools that guarantee optimal network functionality. Devices such as oscilloscopes, signal generators, and network analyzers are vital for verifying 5G system performance. For example, digital oscilloscopes leverage Analog-to-Digital Converters (ADC) to analyze 5G waveforms, which is critical for diagnosing signal and component issues.

Government policies and initiatives are also major contributors to market growth. Federal efforts aimed at revitalizing semiconductor manufacturing domestically have increased the need for high-precision testing instruments. Through financial incentives and research grants, the U.S. government is fostering the development of advanced manufacturing plants that require stringent quality control and compliance verification.

Order a free sample PDF of the U.S. Test And Measurement Equipment Market Intelligence Study, published by Grand View Research.

Key Market Trends & Insights

  • By product, the general-purpose test equipment segment led the market in 2024. This trend reflects a growing focus in electronics and manufacturing industries on precision, reliability, and compliance. Such equipment facilitates accurate measurement and diagnostics critical for product development and quality assurance.
  • By service, calibration services accounted for the largest share of the market in 2024. As sectors like aerospace, defense, automotive, and healthcare increasingly adopt advanced testing tools, the importance of regular calibration to maintain equipment accuracy, comply with industry standards, and prevent costly errors has grown.
  • By end use, the automotive and transportation sector dominated in 2024. This is due to the increasing incorporation of advanced electronics, safety features, and autonomous technologies in modern vehicles. High-precision testing tools are essential for stages ranging from powertrain testing to validating Advanced Driver Assistance Systems (ADAS).

Market Size & Forecast

  • 2024 Market Size: USD 8.27 Billion
  • 2030 Projected Market Size: USD 10.96 Billion
  • CAGR (2025-2030): 5.0%

Key Companies & Market Share Insights

Notable players in this market include Keysight Technologies, Fortive, National Instruments Corp., and AMETEK, Inc.

  • Keysight Technologies is well-regarded for accelerating product development through cutting-edge design, emulation, and testing solutions, helping companies innovate with deep measurement expertise.
  • Fortive offers crucial technologies for connected workflow solutions across impactful industries, with brands like Tektronix and Fluke operating in areas such as Intelligent Operating Solutions, Precision Technologies, and Advanced Healthcare Solutions.

Key Players

  • Keysight Technologies
  • Fortive
  • National Instruments Corp.
  • Teledyne Technologies Incorporated.
  • VIAVI Solutions Inc.
  • Particle Measuring Systems
  • AMETEK, Inc.
  • Astronics Corporation
  • Crystal Instruments Corporation
  • DS Instruments

Explore Horizon Databook – The world's most expansive market intelligence platform developed by Grand View Research.

Conclusion

The U.S. test and measurement equipment market is poised for steady growth driven by the expanding complexity of electronics and rapid adoption of emerging technologies like 5G, IoT, and AI. Government initiatives aimed at bolstering domestic manufacturing and stringent quality requirements further underpin this expansion. With automotive and telecommunications sectors leading demand, and calibration services gaining prominence, the market is set to evolve with advancements in precision and reliability. Key industry players continue to innovate and expand their offerings, positioning themselves for success in this growing and dynamic landscape.

Thursday, August 28, 2025

Green Data Center Market 2030: Revolutionizing Sustainability in Tech

The global green data center market was valued at USD 70.45 billion in 2024 and is projected to reach USD 200.46 billion by 2030, growing at a CAGR of 19.0% from 2025 to 2030. The market is experiencing rapid growth, fueled by rising energy costs, stringent environmental regulations, and an increasing emphasis on corporate sustainability goals. These factors are driving organizations to transition toward energy-efficient data center infrastructures.

Green data center market size and growth forecast in USD billion with CAGR (2025-2030)

The growing adoption of cloud computing, Internet of Things (IoT), and big data analytics requires scalable, eco-friendly data centers. Technological advancements in cooling systems, renewable energy integration, and modular design are improving data center efficiency and sustainability. Government regulations promoting sustainable IT practices are also playing a critical role. Initiatives such as the EU’s Climate Neutral Data Centre Pact and the U.S. Energy Efficiency and Renewable Energy programs are compelling organizations to adopt green technologies, not only to meet compliance standards but also to enhance their corporate social responsibility (CSR) image and attract environmentally conscious stakeholders.

Increased awareness of environmental responsibility among businesses and consumers is contributing to market expansion. Tech giants like Google, Microsoft, and Amazon are investing significantly in carbon-neutral and energy-efficient data centers to meet their net-zero commitments, setting industry standards. This momentum is encouraging mid-sized and smaller enterprises to follow suit. Additionally, the rise of edge computing and 5G networks is creating demand for decentralized and energy-efficient infrastructure, further boosting the market.

Order a free sample PDF of the Green Data Center Market Intelligence Study, published by Grand View Research.

Key Market Trends & Insights

  • North America held the largest market share in 2024, accounting for 37.0% of total revenue. This dominance is driven by major hyperscale and cloud service providers such as Amazon Web Services (AWS), Microsoft Azure, Google Cloud, and Meta, who are investing heavily in large-scale, renewable-powered data centers across the U.S. and Canada.
  • By component, the solution segment led with a revenue share of 63.3% in 2024, supported by growing demand for efficient cooling technologies like liquid cooling and free cooling. These technologies significantly reduce energy usage compared to traditional air-based systems and are critical in high-density data center environments.
  • By enterprise size, large enterprises held the majority share at 72.0% in 2024. These organizations handle vast amounts of data generated from digital transformation efforts, AI, CRM, and edge computing, which necessitate high-performance, energy-intensive infrastructure—driving the need for greener solutions.
  • By end use, the BFSI (Banking, Financial Services, and Insurance) sector dominated with a 23.7% revenue share in 2024. The expansion of digital banking, fintech, blockchain, and AI-based fraud detection systems has driven demand for low-latency, high-efficiency data centers to support secure and sustainable operations.

Market Size & Forecast

  • 2024 Market Size: USD 70.45 Billion
  • 2030 Projected Market Size: USD 200.46 Billion
  • CAGR (2025-2030): 19.0%
  • North America: Largest market in 2024
  • Asia Pacific: Fastest growing market

Key Companies & Market Share Insights

Key players in the green data center market include Schneider Electric, Vertiv Group Corp., Equinix, Inc., Digital Realty Trust, and Huawei Technologies Co., Ltd. These companies are actively pursuing strategies such as product innovation, strategic partnerships, and collaborative agreements to strengthen their market positions and offer sustainable data center solutions worldwide.

Key Players

  • ABB
  • Asetek Inc.
  • Cisco Systems, Inc.
  • Dell Inc.
  • Delta Electronics, Inc.
  • Digital Realty Trust
  • Equinix, Inc.
  • Fujitsu
  • General Electric
  • Hewlett Packard Enterprise Development LP
  • Hitachi Energy Ltd.
  • Huawei Technologies Co., Ltd.
  • IBM Corporation
  • Schneider Electric
  • Siemens
  • Vertiv Group Corp.

Explore Horizon Databook – The world's most expansive market intelligence platform developed by Grand View Research.

Conclusion

The green data center market is undergoing robust growth as businesses prioritize sustainability, cost-efficiency, and regulatory compliance. With energy consumption and environmental impact becoming central concerns, organizations across industries are transitioning to greener IT infrastructure. Supportive government policies, innovation in energy-efficient technologies, and commitments from leading tech firms to achieve carbon neutrality are accelerating this shift. As the demand for data continues to surge with cloud computing, edge technologies, and 5G rollout, the global green data center market is expected to play a vital role in enabling a more sustainable digital future.

Geothermal Energy Market: Harnessing Earth’s Heat for a Sustainable Future

The global geothermal energy market was valued at USD 7.45 billion in 2023 and is projected to reach USD 9.22 billion by 2030, growing at a CAGR of 3.1% from 2024 to 2030. The increasing demand for uninterrupted power supply across residential, commercial, and industrial sectors, along with a growing emphasis on sustainable energy sources, is driving the expansion of the geothermal energy market.

Global Geothermal Energy Market share and size, 2023

Geothermal energy is derived from naturally occurring underground reservoirs of hot water and steam. Its application across multiple sectors contributes to reducing dependence on fossil fuels and lowering greenhouse gas emissions. As countries worldwide intensify efforts to meet carbon reduction goals and transition to cleaner energy sources, geothermal energy stands out as a promising alternative for meeting rising energy demands sustainably.

In the United States, the adoption of renewable energy solutions is being accelerated by government policies such as the Inflation Reduction Act (IRA) of 2022 and the Infrastructure Investment and Jobs Act. These legislative efforts support clean energy initiatives and provide incentives for the deployment of renewable technologies. Rising electricity distribution costs, increasing frequency of grid failures, and the appeal of energy reliability are also expected to push more end-users toward geothermal power solutions, supporting broader market growth.

Order a free sample PDF of the Geothermal Energy Market Intelligence Study, published by Grand View Research.

Key Market Trends & Insights

  • Asia Pacific held the largest share of the geothermal energy market in 2023, accounting for 34.7% of total revenue, and is anticipated to grow at the fastest CAGR over the forecast period. The regional market is being driven by the demand for geothermal heat pumps, especially in the residential sector, for efficient space heating and cooling. Population growth, economic development, and the presence of a strong manufacturing base further bolster regional demand.
  • By technology, the binary cycle power plant segment captured the highest market share at 30.5% in 2023. These plants utilize lower temperature geothermal resources, which are more commonly found across various regions, making them ideal for expanding geothermal energy deployment in areas with moderate to low geothermal heat availability.
  • By power capacity, the above 5 MW segment dominated the market in 2023 with a 56.4% revenue share. This reflects the growing demand for high-capacity geothermal power plants capable of generating sufficient electricity to meet the needs of industrial and commercial facilities. The segment is also benefiting from the reliability and sustainability of geothermal energy as a baseload power source.
  • By application, the residential sector led with a 40.7% share in 2023, driven by increasing demand for geothermal systems for space heating and cooling. Geothermal heat pumps are becoming a renewable alternative to conventional HVAC systems and also offer the benefit of domestic hot water supply.

Market Size & Forecast

  • 2023 Market Size: USD 7.45 Billion
  • 2030 Projected Market Size: USD 9.22 Billion
  • CAGR (2024-2030): 3.1%
  • Asia Pacific: Largest market in 2023
  • Europe: Fastest growing market

Key Companies & Market Share Insights

Leading market players are focusing on both organic and inorganic strategies such as technology development, mergers, acquisitions, and strategic partnerships to strengthen their market presence:

  • February 2024: Terrapin and TerraScale announced a merger to support expansion into Canada, Japan, and Switzerland, with a focus on geothermal projects.
  • February 2024: Pertamina Geothermal Energy partnered with Turkey’s Kipas Holding for joint exploration and investment in renewable energy.
  • November 2023: Google and Fervo launched their first geothermal energy project in Nevada, U.S., delivering carbon-free energy to the power grid.
  • September 2023: Dandelion Energy collaborated with Palmetto to integrate residential solar energy with geothermal heating and cooling systems.

Key Players

  • Turboden S.p.A.
  • Alterra Power Corporation
  • TAS Energy
  • Atlas Copco Group
  • Exergy
  • Toshiba Corporation
  • Mitsubishi Heavy Industries
  • General Electric
  • Ansaldo Energia
  • Ormat Technologies

Explore Horizon Databook – The world's most expansive market intelligence platform developed by Grand View Research.

Conclusion

The global geothermal energy market is steadily expanding, supported by increasing demand for reliable, clean, and sustainable energy solutions. While the growth rate is moderate, at a CAGR of 3.1%, long-term prospects remain positive due to favorable government policies, rising grid infrastructure challenges, and increasing investments in renewable energy. Asia Pacific leads the market, with Europe showing the fastest growth potential. Technological advancements and strategic collaborations are expected to play a crucial role in unlocking new opportunities, enhancing geographic reach, and making geothermal energy a key contributor to the global transition toward decarbonization and energy sustainability.

Garbage Bags Market 2030: Unpacking Growth Trends by Material

The global garbage bags market was valued at USD 11,713.0 million in 2023 and is projected to reach USD 18,273.5 million by 2030, registering a CAGR of 6.7% from 2024 to 2030. Garbage bags, primarily manufactured from polyethylene, are favored for their strength, light weight, and secure containment properties. These attributes make them widely used across retail, institutional, and industrial applications.

Garbage Bags Market Size by Material, 2020 - 2030 (USD Billion)

Rising awareness about hygiene and environmental sanitation is contributing to the growing adoption of garbage bags. The pace of urbanization is accelerating waste generation globally, in turn increasing the demand for waste disposal solutions. According to the World Bank, annual global waste production is expected to increase by 70% from 2016 levels, reaching 3.40 billion tonnes by 2050. These dynamics are supporting a strong growth outlook for the garbage bags market.

However, fluctuations in raw material costs and regulatory restrictions on plastic usage are impacting manufacturers and consumers alike. The COVID-19 pandemic added further challenges, causing instability in supply chains, labor shortages, and variability in raw material pricing. While initial disruptions were minimal, ongoing operational challenges continue to affect the stability of production and pricing structures in the industry.

Order a free sample PDF of the Garbage Bags Market Intelligence Study, published by Grand View Research.

Key Market Trends & Insights

  • Asia Pacific held a dominant position in 2023, accounting for 34.54% of total revenue. Increasing environmental consciousness and supportive regulatory measures are encouraging the use of biodegradable and eco-friendly garbage bags. Leading manufacturers are expanding production and distribution networks in response to growing demand in the region.
  • Low-density polyethylene (LDPE) garbage bags made up 42.50% of market revenue in 2023. LDPE is gaining popularity due to its flexibility, tear resistance, and durability, making it ideal for a wide range of uses.
  • 3-13 gallon garbage bags represented the largest size segment in 2023, contributing 53.05% of revenue. These bags are commonly used in households and offices due to their suitability for daily waste disposal, particularly in compact living environments.
  • The household segment was the leading end-user category in 2023, accounting for 58.70% of revenue. Increasing urbanization, rising incomes, and the demand for efficient home waste solutions are driving growth in this segment. Product innovations like odor control and drawstring features are also enhancing consumer appeal.
  • The B2C distribution channel led the market in 2023 with a 62.92% revenue share. Hypermarkets and supermarkets offering discounts, promotions, and bulk buying options are attracting consumers. The growing trend of convenient one-stop shopping further fuels demand through this channel.

Market Size & Forecast

  • 2023 Market Size: USD 11,713.0 Million
  • 2030 Projected Market Size: USD 18,273.5 Million
  • CAGR (2024-2030): 6.7%
  • Asia Pacific: Largest market in 2023

Key Companies & Market Share Insights

The competitive landscape includes both well-established global corporations and emerging regional players. Major companies focus on innovation, customization, and the development of distinctive products to meet changing consumer needs. Their strong global distribution capabilities enable them to effectively penetrate emerging markets and cater to a diverse customer base.

Key Players

  • Pack-It BV
  • Kemii Garbage Bag Co. Ltd
  • Cosmoplast Industrial Company LLC( Harwal Group of Companies)
  • Luban Packing LLC
  • Hefty(Reynolds Consumer Products LLC)
  • International Plastics Inc.
  • Novolex
  • Novplasta s.r.o.
  • Terdex GmbH
  • Berry Global Inc.

Explore Horizon Databook – The world's most expansive market intelligence platform developed by Grand View Research.

Conclusion

The global garbage bags market is poised for steady growth through 2030, driven by rising waste generation, increasing environmental awareness, and the demand for hygienic waste disposal solutions. While the market faces challenges such as raw material price volatility and regulatory constraints, the shift towards sustainable and efficient waste management practices is opening up new opportunities. Strategic investments in innovation, regional expansion, and eco-friendly product development will be critical for companies aiming to capture market share in this evolving landscape.

Digital Healthcare Supply Chain Management Market: Navigating the Future of Health Logistics

The global digital healthcare supply chain management market was valued at USD 2.9 billion in 2023 and is projected to reach USD 5.4 billion by 2030, growing at a CAGR of 9.0% from 2024 to 2030. Market growth is being driven by rising investments in advanced technologies such as control towers, digital twin solutions, and the widespread adoption of dashboards to improve analytics, execution, and real-time visibility across healthcare supply chains. Additionally, supportive government initiatives aimed at enhancing medical supply systems are contributing significantly to the market's expansion.

Digital Healthcare SCM Market

The emergence of cloud-based solutions and the growing demand to combat counterfeit drugs in the pharmaceutical industry are expected to further support market growth. The increasing global adoption of cloud computing has transformed supply chain management in the healthcare sector. Cloud-based SCM software enables better supplier performance and inventory optimization. For example, Jump Technologies offers JumpStock, a cloud-based system that integrates with ERP, EMR, and scheduling platforms, helping hospitals reduce costs tied to physician preference variation, stock hoarding, and stockouts. Furthermore, cloud-enabled traceability helps manufacturers minimize the financial impact of recalls by identifying product quality issues early.

Rising transportation costs are also increasing operational expenses for healthcare providers. A large portion of these costs is associated with inventory storage, manufacturing, and production inefficiencies. Poor inventory management remains a persistent challenge. A 2022 NCBI study revealed that U.S. hospitals waste USD 25.4 billion annually due to inefficient supply chain practices. To address these challenges, healthcare organizations are adopting tools such as inventory management software, Kanban systems, and barcode scanning terminals to optimize operations and minimize losses.

Order a free sample PDF of the Digital Healthcare Supply Chain Management Market Intelligence Study, published by Grand View Research.

Key Market Trends & Insights

  • North America led the market in 2023, holding a 32.9% revenue share, due to the region’s focus on digital efficiency, AI integration, and cost-saving technologies across the healthcare supply chain.
  • By product, the software segment held the largest revenue share of 39.8% in 2023 and is projected to grow at the fastest CAGR of 9.3% during the forecast period. The shift toward Software-as-a-Service (SaaS) offerings, especially cloud-based applications for supply chain and resource planning, is fueling this growth.
  • By deployment, the cloud-based segment accounted for the highest market share at 40.43% in 2023 and is expected to expand at the fastest CAGR of 9.3% through 2030. The segment benefits from increasing demand for cost-effective and easy-to-use technology.
  • By end use, the pharmaceutical sector led with a 36.5% revenue share in 2023. The need for strict regulatory compliance regarding product tracking and tracing throughout the supply chain has heightened demand for digital SCM solutions in this sector.

Market Size & Forecast

  • 2023 Market Size: USD 2.9 Billion
  • 2030 Projected Market Size: USD 5.4 Billion
  • CAGR (2024-2030): 9.0%
  • North America: Largest market in 2023
  • Asia Pacific: Fastest growing market

Key Companies & Market Share Insights

The competitive landscape is evolving due to increasing product innovation, the presence of strict regulatory frameworks, and government-backed digital health initiatives. Leading companies are engaging in mergers and acquisitions, partnerships, and collaborations to expand their geographical footprint and strengthen their customer base. Key players in the market include those offering comprehensive SCM solutions tailored to meet the evolving needs of the global healthcare industry.

Key Players

  • Palantir Technologies, Inc.
  • InterSystems Corporation
  • ump Technologies, Inc.
  • Tecsys
  • LogiTag Systems
  • Mckesson Corporation
  • Oracle
  • SAP
  • Infor
  • Terso Solutions
  • CenTrak (HALMA plc)
  • Biolog-ID
  • Mediceo Corporation

Explore Horizon Databook – The world's most expansive market intelligence platform developed by Grand View Research.

Conclusion

The global digital healthcare supply chain management market is on a strong growth trajectory, propelled by the adoption of advanced digital technologies, increased focus on cloud-based solutions, and the urgent need to improve efficiency and traceability across healthcare supply chains. With rising pressure to control costs, reduce waste, and ensure regulatory compliance, digital SCM tools are becoming essential across pharmaceuticals, medical devices, and healthcare services. As healthcare organizations continue to modernize and digitize operations, the market is expected to witness sustained growth through 2030, with cloud-based platforms and AI-driven analytics playing a central role in shaping the future of healthcare logistics.

U.S. Tablet Market 2030: Navigating the Digital Landscape

U.S. Tablet Market Overview

The U.S. tablet market was valued at USD 12.86 billion in 2023 and is projected to reach USD 14.08 billion by 2030, growing at a CAGR of 1.5% from 2024 to 2030. Tablets continue to appeal to both personal and professional users due to their high mobility, user-friendly interface, and ability to perform a range of functions such as reading, entertainment, and communication. Functioning as a hybrid between smartphones and laptops, tablets are becoming essential tools in the digital age.

Market growth is largely driven by the growing adoption of remote work and remote learning solutions, along with technological advancements that improve device performance and media consumption capabilities. The increasing availability of high-speed internet and the rollout of 5G technology are expected to further fuel demand for tablets across various segments.

U.S. Tablet Market Size by Product, 2020 - 2030 (USD Billion)

Another key growth driver is the integration of tablets with the Internet of Things (IoT). Tablets are increasingly used as control centers for smart home devices, providing users with enhanced control and connectivity. Additionally, tablets are playing a growing role in business applications related to inventory management, field operations, and supply chain monitoring, further strengthening their position in the enterprise landscape.

The expanding ecosystem of tablet-optimized applications and software solutions is encouraging adoption across individual consumers and industries. From educational platforms to healthcare tools and business applications, the development of purpose-built software maximizes the utility of tablets, making them attractive investments for both personal and commercial use.

Order a free sample PDF of the U.S. Tablet Market Intelligence Study, published by Grand View Research.

Key Market Trends & Insights

  • By product, the slate tab PC segment led the market with a 48.8% share in 2023. Their lightweight, slim design and affordability cater to users seeking portability, making them a popular choice across both consumer and professional segments.
  • By operating system, iOS held the largest share at 42.6% in 2023. Apple’s brand loyalty, product quality, and ecosystem integration (with iPhones, Macs, and iCloud) drive repeat purchases and high market retention.
  • By screen resolution, the 768 x 1024 segment maintained a significant share in 2023. Its balance of affordability and adequate visual clarity for tasks such as reading and browsing makes it especially attractive in education and budget-focused segments.
  • By distribution channel, the offline segment is projected to grow at a CAGR of 0.4% during the forecast period. Many consumers continue to prefer in-store shopping to experience the device firsthand before making a purchase decision.

Market Size & Forecast

  • 2023 Market Size: USD 12.86 Billion
  • 2030 Projected Market Size: USD 14.08 Billion
  • CAGR (2024-2030): 1.5%

Key Companies & Market Share Insights

The U.S. tablet market is characterized by the presence of leading tech giants and rising competition focused on product innovation, ecosystem expansion, and strategic collaborations. Key players include Apple, Samsung, TCL, Microsoft, and Lenovo, among others.

  • Apple remains a dominant player due to its design excellence and integration across hardware, software, and services. Its product lineup includes iPad, iPhone, Mac, and associated services such as iCloud, Apple Music, and the App Store.
  • Lenovo offers a diverse portfolio, including tablets, laptops, desktops, and smart home devices. It also provides data center solutions and caters to both individual users and enterprise customers.

Companies in the market continue to pursue strategies like mergers, acquisitions, and partnerships to expand their reach and maintain competitiveness.

Key Players

  • Apple
  • Amazon
  • Samsung
  • TCL
  • Microsoft
  • Alcatel
  • Google
  • Motorola
  • Asus
  • Lenovo

Explore Horizon Databook – The world's most expansive market intelligence platform developed by Grand View Research.

Conclusion

The U.S. tablet market is experiencing steady growth, fueled by remote work and learning trends, improved connectivity, and evolving consumer needs. Tablets are increasingly integrated into both everyday life and enterprise operations, supported by developments in IoT, cloud services, and application ecosystems. While the market is maturing, consistent innovation, ecosystem enhancements, and user demand for flexibility and mobility are expected to sustain modest growth through 2030. As key players continue to refine their offerings and align with digital transformation trends, tablets will remain a vital segment of the broader consumer electronics market in the U.S.

U.S. Solar PV Market: Harnessing Sunshine for a Sustainable Future

U.S. Solar Photovoltaic (PV) Market Overview

The U.S. solar PV market was valued at USD 29.68 billion in 2022 and is projected to reach USD 96.6 billion by 2030, growing at a CAGR of 13.7% from 2023 to 2030. The market’s rapid expansion is being driven by favorable state and federal policies, incentive programs, and a consistent decline in solar panel costs. These factors have significantly accelerated the adoption of solar PV systems across the country.

The U.S. has seen a notable rise in installed solar power capacity in recent years, primarily due to growing concerns about environmental sustainability and the urgent need to mitigate greenhouse gas emissions. These factors have spurred growth, particularly in the utility sector, as utility-scale solar installations have become more prominent.

U.S. Solar PV Market share and size, 2022

Supportive regulatory frameworks and heightened interest from private sector investors are also major contributors to market growth. As emission regulations tighten, the transition from traditional fossil fuel-based power generation to renewable sources like solar is becoming more pronounced. This shift is reshaping the overall power generation landscape in the U.S., favoring clean energy over coal and gas.

The increasing volatility in fossil fuel prices has further prompted investments in solar and other renewable energy sources to stabilize long-term electricity costs. Solar energy is not only more sustainable but has also become more cost-effective—with new solar installations now often cheaper than traditional coal or gas plants. States like California and Texas have played pivotal roles by offering robust incentives and tax benefits to promote solar adoption. For example, California alone has invested USD 80.8 billion in solar energy over the past decade, implementing various programs to encourage residential solar installations.

Order a free sample PDF of the U.S. Solar PV Market Intelligence Study, published by Grand View Research.

Key Market Trends & Insights

  • By application, the utility segment held the largest revenue share at 66.68% in 2022. Increasing consumer preference for environmentally responsible energy sources is a key driver, alongside efforts to lower carbon emissions and support sustainable energy infrastructure.
  • The residential segment is projected to grow at the fastest CAGR of 13.9% during the forecast period. Rising adoption of solar PV at the residential level, backed by favorable government incentives, is driving growth in this segment from 2023 to 2030.
  • The commercial segment is expected to grow at a stable pace. With rising grid energy costs, many commercial entities are opting to reduce dependency on external power by installing in-house solar PV systems.

Market Size & Forecast

  • 2022 Market Size: USD 29.68 Billion
  • 2030 Projected Market Size: USD 96.6 Billion
  • CAGR (2023-2030): 13.7%

Key Companies & Market Share Insights

Leading players in the U.S. solar PV market are focusing on technological innovation and cost reduction to enhance their competitiveness. Many are also adopting strategic initiatives to expand their presence in the renewable energy landscape.

For instance, in April 2022, Primenergy announced the construction of the largest solar PV plant in the U.S., located in Nevada, with a projected capacity of 690 MW. The facility was expected to be operational by 2023 and reflects the growing momentum toward large-scale solar deployment in the country.

Key Players

  • First Solar
  • SunPower
  • Suniva
  • 1Soltech
  • Sharp
  • Alps Technology
  • Advance power
  • Auxin solar
  • BORG Inc.
  • Pionis Energy

Explore Horizon Databook – The world's most expansive market intelligence platform developed by Grand View Research.

Conclusion

The U.S. solar PV market is undergoing robust growth, underpinned by a favorable regulatory environment, consistent cost reductions, and a nationwide shift toward clean energy. With support from federal and state incentive programs and increasing awareness of environmental impacts, both utility-scale and residential solar installations are gaining significant traction. The volatility of fossil fuel markets and the rising costs of traditional energy sources are further accelerating the transition to solar power. As technology continues to improve and costs decline, solar PV is expected to play a critical role in the U.S. energy mix, contributing to national decarbonization goals and energy security through 2030 and beyond.