Pages

Thursday, July 31, 2025

South Korea Endoscopy Devices Market: A Surge in Minimally Invasive Innovations

South Korea Endoscopy Devices Market Overview

The South Korea endoscopy devices market was valued at USD 368.09 million in 2023 and is projected to reach USD 694.83 million by 2030, growing at a compound annual growth rate (CAGR) of 9.48% from 2024 to 2030. This growth is largely driven by advancements in minimally invasive surgical (MIS) technologies, which have heightened the demand for endoscopic procedures. Innovations such as capsule endoscopy and robot-assisted techniques are supporting this shift by offering less invasive alternatives to traditional surgeries.

In addition, ongoing developments in endoscopic visualization systems and operative tools are expected to further propel market expansion. The increase in healthcare facilities—including hospitals, cancer treatment centers, and specialty oncology clinics—has also contributed to the rising demand for advanced endoscopy equipment. Upgrades in healthcare infrastructure and the adoption of cutting-edge endoscopic technologies are further supporting the market’s upward trajectory.

South Korea Endoscopy Devices Market Concentration & Characteristics

The use of endoscopic devices for both diagnostic and therapeutic applications is growing rapidly. These tools facilitate minimally invasive procedures, enabling faster patient recovery, shorter hospital stays, and reduced postoperative complications. By minimizing tissue damage and blood loss, endoscopy devices provide safer, more cost-effective alternatives to open surgeries.

Following the introduction of the National Health Insurance Service (NHIS) in 1989, healthcare expenditure per capita in South Korea has steadily increased. According to OECD Health at a Glance (2023), South Korea now spends USD 4,570 per capita on healthcare. Despite these rising expenditures, the country’s healthcare costs remain relatively low from the provider’s perspective. The emphasis on high-quality care at reduced costs enhances accessibility for patients while ensuring sufficient reimbursement for providers, which in turn supports overall market growth.

Order a free sample PDF of the South Korea Endoscopy Devices Market Intelligence Study, published by Grand View Research.

Key Market Trends & Insights

  • By Product: In 2023, endoscopy visualization components accounted for the largest revenue share at 36.07%. This dominance stems from South Korea’s significant investment in R&D, leading to high-quality medical devices. Innovations such as high-definition cameras, advanced lighting systems, and precision monitors contribute to more accurate diagnostics and improved outcomes.
  • By Application: The gastrointestinal (GI) endoscopy segment led the market with a 55.52% revenue share. South Korea has a relatively high prevalence of GI disorders, including gastric and colorectal cancers. As reported by the Annals of Coloproctology (2022), around 29,030 new colorectal cancer cases are diagnosed annually. Furthermore, the mortality rate due to colorectal cancer increased from 8.78 per 100,000 in 2000 to 17.27 per 100,000 in 2022.
  • By End-Use: The hospital segment held the largest market share at 46.73% in 2023. This is attributed to the high number of surgical procedures performed in hospitals and the country's well-established healthcare infrastructure. Moreover, the high costs of advanced endoscopic procedures often necessitate hospital-based access.

Market Size & Forecast

  • 2023 Market Size: USD 368.09 Million
  • 2030 Projected Market Size: USD 694.83 Million
  • CAGR (2024-2030): 9.48%

Key Companies & Market Share Insights

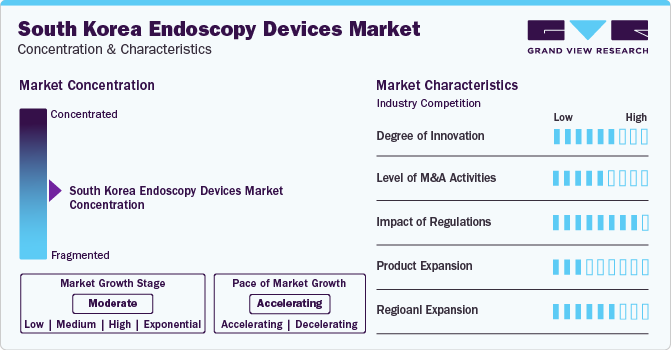
The South Korea endoscopy devices market is fragmented, with several major players holding a significant market share. Leading companies includes, Olympus Corporation, PENTAX Medical, KARL STORZ SE & Co. KG and FUJIFILM Holdings Corporation.

To remain competitive, these firms are pursuing strategies such as mergers and acquisitions, increased R&D investments, and product innovations or enhancements. Strategic collaborations are also playing an essential role in expanding market presence across the country.

Key Players

  • Olympus Corporation
  • FUJIFILM Holdings Corporation
  • KARL STORZ SE & Co. KG
  • Stryker Corporation
  • Medtronic plc
  • Conmed Corporation
  • Boston Scientific Corporation
  • Smith & Nephew plc
  • Richard Wolf GmbH

Explore Horizon Databook – The world's most expansive market intelligence platform developed by Grand View Research.

Conclusion

The South Korean endoscopy devices market is poised for substantial growth through 2030, fueled by technological innovations, increasing demand for minimally invasive procedures, and improvements in healthcare infrastructure. The strong presence of leading market players, coupled with rising per capita healthcare expenditure and government support, positions the country as a promising environment for endoscopy advancements. As clinical needs evolve and new technologies emerge, the market is expected to continue its upward momentum, making it a key sector within South Korea's broader medical device landscape.

Self-storage Market Trends: Unlocking the Future of Space Solutions

The global self-storage market was valued at approximately USD 56.81 billion in 2023 and is projected to reach USD 83.20 billion by 2030, growing at a compound annual growth rate (CAGR) of 5.9% from 2024 to 2030. Several factors are driving the growth of the self-storage market, enhancing its significance in the real estate and logistics sectors. Key contributors include urbanization, population growth, and the expansion of e-commerce and retail.

Self-storage Market Share by Application, 2023 (%)

Self-storage services offer secure and convenient storage units that individuals or businesses can rent when they need extra space for their belongings. These facilities are ideal for both temporary and long-term storage solutions. They are especially useful during relocation, providing a secure space to keep belongings while individuals look for new homes or apartments. Additionally, self-storage is beneficial for businesses needing extra space for inventory or equipment, allowing business owners to store items like furniture and office supplies without cluttering their workspaces.

The self-storage sector is witnessing a significant trend toward enhancing customer convenience, focusing on delivering seamless user experiences. Facilities are increasingly investing in intuitive websites and online platforms, enabling customers to easily book and manage their storage units remotely. Moreover, the implementation of contactless access options allows individuals to retrieve their belongings without physical contact, addressing safety concerns. These efforts reflect broader industry initiatives aimed at adapting to evolving customer expectations and preferences.

Order a free sample PDF of the Self-storage Market Intelligence Study, published by Grand View Research.

Key Market Trends & Insights

  • The North America self-storage market dominated globally, accounting for over 47.0% of the revenue share in 2023. Factors driving growth in this region include an aging population and the growing integration of technology in self-storage units. As the North American population ages, many individuals downsize their living spaces, necessitating storage for personal belongings they wish to retain but cannot accommodate in smaller homes or retirement communities.
  • By unit size, the medium segment led the market, holding over 45.0% of the share in 2023. The growth of this segment is attributed to the versatility and cost-effectiveness of medium-sized self-storage units. These units strike a balance between space and cost, making them ideal for storing household items, furniture, and business inventory, thus catering to both individual and business customers.
  • In terms of application, the personal segment dominated in 2023, accounting for more than 66.0% of global revenue. This growth is driven by increasing urbanization, the rise of smaller living spaces, and changing lifestyles. As more individuals move to urban areas, the trend toward smaller living environments creates a demand for additional storage solutions for personal belongings that cannot fit in compact apartments or homes.

Market Size & Forecast

  • 2023 Market Size: USD 56.81 Billion
  • 2030 Projected Market Size: USD 83.20 Billion
  • CAGR (2024-2030): 5.9%
  • North America: Largest market in 2023
  • Asia Pacific: Fastest growing market

Key Companies & Market Share Insights

Key players in the self-storage market include CubeSmart, Public Storage, Life Storage Inc., and Safestore, among others.

  • CubeSmart, based in Pennsylvania, U.S., is a self-administered and self-managed Real Estate Investment Trust (REIT) that specializes in owning, acquiring, operating, and developing self-storage facilities. The company offers various storage unit sizes and types, including climate-controlled and outdoor options, with a strong emphasis on customer service and convenience through advanced facility technologies.

Emerging companies in the market include SmartStop Self Storage and Storage Giant.

  • SmartStop Self Storage is a diversified real estate company focused on self-storage assets. It operates as a self-administered and self-managed REIT and owns and manages a portfolio of self-storage facilities across the U.S. and Canada, providing solutions for personal, business, and vehicle storage needs.

Key Players

  • CubeSmart
  • Metro Storage LLC
  • SmartStop Self Storage
  • Life Storage Inc.
  • Safestore
  • W. P. Carey Inc.
  • Public Storage
  • Prime Storage
  • Shurgard Self Storage
  • Storage Giant
  • Big Yellow Self Storage Company

Explore Horizon Databook – The world's most expansive market intelligence platform developed by Grand View Research.

Conclusion

The self-storage market is set for robust growth, driven by increasing urbanization, population growth, and the need for flexible storage solutions among individuals and businesses. As customer preferences shift toward convenience and technology integration, self-storage facilities are adapting to meet these demands through improved services and innovative solutions. The continued expansion of e-commerce and retail will further enhance the relevance of self-storage in the logistics sector. With North America leading the market and Asia Pacific emerging as the fastest-growing region, the self-storage industry is positioned for significant opportunities in the coming years.

Satellite Transponder Market 2033: Navigating the Future of Connectivity

Global Satellite Transponder Market Overview

The global satellite transponder market was valued at USD 14,911.0 million in 2024 and is projected to reach USD 21,987.2 million by 2033, growing at a CAGR of 4.5% from 2025 to 2033. This growth is primarily driven by increasing demand for high-throughput satellite (HTS) services, expanding Direct-to-Home (DTH) broadcasting subscriptions, and the growing need for secure and reliable communication in sectors such as defense and aviation.

Satellite transponder market size and growth forecast (2023-2033)

The market's expansion is closely tied to the rising need for consistent broadband and telecommunication services, particularly in remote and underserved regions, which has led to accelerated deployment of satellite transponders. Additionally, significant technological advancements—such as the adoption of Ka-band and Ku-band transponders—are enhancing transmission efficiency and network reach.

Investments in defense, surveillance, and navigation systems are also increasing, as both governments and private stakeholders improve satellite infrastructure to support space-based communication and IoT connectivity. These combined factors are supporting steady global market growth.

Order a free sample PDF of the Satellite Transponder Market Intelligence Study, published by Grand View Research.

Key Market Trends & Insights

  • Regional Trends: North America led the global satellite transponder market in 2024, accounting for 41.5% of total revenue. This dominance is supported by advanced space infrastructure, widespread satellite communication adoption, and growing demand for broadband internet in rural and remote areas.
  • Frequency Band Insights: The C band segment held the largest share of the market in 2024, with more than 36% of total revenue. This segment's strength is attributed to its extensive use in broadcasting and telecommunications, where stable and wide-area signal transmission is critical. C band transponders are commonly used for satellite television, radio, and data services.
  • Satellite Platform: Geostationary Earth Orbit (GEO) satellites dominated the market in 2024, contributing 68.7% of total revenue. GEO satellites are preferred for their ability to provide continuous coverage over fixed geographic areas, making them ideal for television broadcasting and telecom services due to their high transponder capacity.
  • Application Segment: The commercial communications segment accounted for the highest revenue share in 2024. This was driven by the growing demand for high-speed data transmission, real-time global coverage, and content distribution. Commercial entities are increasingly turning to satellite transponders to enable uninterrupted communication services.
  • Service Model: The transponder leasing segment dominated the market in 2024, holding a 77.7% revenue share. Its popularity is due to its cost-effective and scalable nature, making it widely adopted by broadcasters, telecom operators, and internet service providers seeking flexible bandwidth solutions without large capital investments.

Market Size & Forecast

  • 2024 Market Size: USD 14,911.0 Million
  • 2033 Projected Market Size: USD 21,987.2 Million
  • CAGR (2025-2033): 4.5%
  • North America: Largest market in 2024
  • Asia Pacific: Fastest growing market

Key Companies & Market Share Insights

  • Intelsat: A global satellite communication leader, Intelsat operates a large fleet of GEO satellites equipped with C-band and Ku-band transponders. The company supports video broadcasting, broadband, and mobility applications across industries including telecom, government, and maritime. Intelsat is modernizing its infrastructure with HTS and software-defined payloads to meet rising data demands.
  • SES S.A.: Based in Luxembourg, SES S.A. provides satellite transponder capacity via a dual fleet of GEO and MEO satellites. The company serves video, enterprise, and government clients using flexible leasing models across C, Ku, and Ka bands. SES continues to expand global coverage with its O3b mPOWER constellation, delivering low-latency, high-throughput services.
  • Thaicom Public Company Limited: Serving markets in Southeast and South Asia as well as parts of Oceania, Thaicom offers transponder capacity for video broadcasting, internet services, and corporate networks. The company is investing in software-defined satellites to support future digital broadcasting and adaptable service delivery.
  • Inmarsat Global Limited: A major provider of mobile satellite services, Inmarsat supports transponder-based communication for aviation, maritime, and defense sectors. Traditionally focused on L-band, it has expanded to Ka-band HTS for high-speed connectivity. Now part of Viasat, Inmarsat is integrating GEO and LEO assets to enhance its transponder and managed service offerings for mission-critical applications.

Key Players

  • Intelsat
  • SES S.A.
  • EUTELSAT COMMUNICATIONS SA
  • Arabsat
  • Telesat
  • EchoStar Corporation
  • Thaicom Public Company Limited.
  • ASIA SATELLITE TELECOMMUNICATIONS CO. LTD.
  • Inmarsat Global Limited
  • Viasat, Inc.

Explore Horizon Databook – The world's most expansive market intelligence platform developed by Grand View Research.

Conclusion

The global satellite transponder market is set for steady and sustained growth through 2033, underpinned by rising demand for high-capacity satellite communication, technological advancements, and increased usage across commercial and defense sectors. As digital connectivity becomes a necessity worldwide—especially in remote regions—satellite transponders will continue playing a vital role in global communication infrastructure. With strong contributions from North America and rapid expansion in Asia Pacific, the market is expected to benefit from ongoing space-tech innovation, public-private investments, and global data demand across industries.

Wednesday, July 30, 2025

South Korea Household Appliances Market: Smart Refrigerators, Smarter Homes

The South Korea household appliances market was valued at USD 8.93 billion in 2024 and is expected to grow at a compound annual growth rate (CAGR) of 5.9% from 2025 to 2030. This growth is largely driven by increasing disposable income levels, the strong presence of domestic manufacturers, significant participation in global trade, and rising local demand for advanced household appliances.

South Korea Household Appliances Incremental Growth Opportunity From 2024 to 2030 (USD Million)

Major global brands such as LG Electronics and Samsung Electronics originate from South Korea, reinforcing local market strength through continuous investment and the availability of cutting-edge appliances. Product innovation and the adoption of modern technologies are shaping new growth avenues for the sector. A notable example is LG Electronics' launch of a redesigned Bottom-Freezer Refrigerator in April 2025, placing the most-used section at eye level for greater convenience—an upgrade aimed at meeting consumer demand for functionality and ease of use.

Competition among global brands continues to drive innovation. In April 2025, Samsung introduced its “AI Home” concept, unveiling a range of smart, innovation-driven appliances at a global launch event held in Seoul. These kinds of technological advancements are positioning South Korea as a leader in the global household appliance industry.

Order a free sample PDF of the South Korea Household Appliances Market Intelligence Study, published by Grand View Research.

Key Market Trends & Insights

  • By Product: In 2024, the major appliances segment accounted for the largest revenue share at 90.3%. This dominance is due to increasing adoption of smart home appliances, especially in urban settings. Demand for AI-powered devices like advanced refrigerators is on the rise, with various brands offering products tailored by functionality, capacity, and size to meet diverse consumer needs.
  • By Distribution Channel: Electronics stores held the highest revenue share in 2024, driven by the wide availability of household appliances in multi-brand retail stores. Offline distribution is preferred by many brands due to stronger brand visibility and consumer preference for in-person product evaluation. Shoppers appreciate the ability to assess material quality, features, and design, contributing to the popularity of physical retail channels.

Market Size & Forecast

  • 2024 Market Size: USD 8.93 Billion
  • 2030 Projected Market Size: USD 12.39 Billion
  • CAGR (2025-2030): 5.9%

Key Companies & Market Share Insights

To meet evolving consumer expectations and increased demand for technologically advanced appliances, these companies are focusing on research and development, product innovation, marketing enhancements, and strategic collaborations.

  • LG Electronics delivers a wide array of products under its Home Appliance Solution (HS) Division, including washing machines, vacuum cleaners, refrigerators, cooking appliances, dryers, and water purifiers.
  • Samsung Electronics Co., Ltd. offers an extensive household appliance portfolio featuring air care devices, washers and dryers, and a variety of small home appliances that align with its commitment to smart living.

Key Players

  • LG Electronics
  • Samsung Electronics Co., Ltd.,
  • HAIER KOREA
  • Panasonic Korea Ltd.
  • Electrolux Korea Ltd.
  • WINIA Electronics Co., Ltd.

Explore Horizon Databook – The world's most expansive market intelligence platform developed by Grand View Research.

Conclusion

The household appliances market in South Korea is poised for steady growth through 2030, supported by a robust manufacturing base, a tech-savvy consumer population, and continuous innovation from global leaders like LG and Samsung. Rising incomes, increased environmental awareness, and the growing popularity of smart and energy-efficient appliances are shaping the future of this sector. With ongoing investments in R&D, strategic product launches, and expanding retail channels, the market is expected to witness consistent demand and evolving consumer engagement over the forecast period.

Sandstone Market 2033: Crushed Stone, Big Impact

Global Sandstone Market Overview

The global sandstone market was valued at USD 1.03 billion in 2024 and is expected to reach USD 1.52 billion by 2033, growing at a CAGR of 5.0% from 2025 to 2033. The increasing use of sandstone in residential, commercial, and public infrastructure projects is driven by its natural aesthetic, durability, and versatile applications.

Rapid urbanization, particularly in emerging economies, is creating significant demand for cost-effective and visually appealing building materials, with sandstone being a top choice for applications such as flooring, wall cladding, façades, and landscaping.

Sandstone Market Share

The global sandstone industry continues to benefit from the growth of the construction and infrastructure sector, especially in developing countries. In nations such as India and China, large-scale urban development and smart city initiatives are promoting the use of sandstone for flooring, pavements, and wall finishes due to its affordability, availability, and visual appeal. For example, Rajasthan in India, which houses some of the world's largest sandstone reserves, has seen a rise in sandstone mining and processing activities supported by government housing and urban development schemes.

Moreover, the market is also being positively influenced by the global movement towards sustainable and eco-friendly building practices. Natural stones like sandstone are increasingly being adopted in European architectural projects to meet green building certifications such as LEED and BREEAM. Countries like Germany and France are using sandstone over concrete for exterior applications due to its lower embodied energy and reduced environmental impact. Notably, the “Green Building” project in Paris incorporated locally sourced sandstone to cut transportation emissions and support local stone industries.

Order a free sample PDF of the Sandstone Market Intelligence Study, published by Grand View Research.

Key Market Trends & Insights

  • Regional Insights: The Asia Pacific region held the largest market share of 37.7% in 2024. The region's growth is driven by large-scale construction activities in countries like India, China, and Vietnam. In India, sandstone holds not only economic value but also cultural and historical significance, as seen in landmarks like the Red Fort, Qutub Minar, and Akshardham Temple.
  • Application Insights: The building and construction segment accounted for a 37.5% share in 2024, making it the leading application area. Sandstone’s popularity in this segment is due to its natural texture, visual appeal, and long-term durability, making it suitable for exterior facades, flooring, wall cladding, paving, and tiles across residential and commercial infrastructure.

Market Size & Forecast

  • 2024 Market Size: USD 1.03 Billion
  • 2033 Projected Market Size: USD 1.52 Billion
  • CAGR (2025-2033): 5.0%
  • Asia Pacific: Largest Market Region in 2024
  • Middle East & Africa: Fastest Growing Market

Key Companies & Market Share Insights

  • Graymont: A privately owned global company specializing in lime and limestone-based materials. Since 1948, Graymont has served the industrial, construction, and agricultural sectors. In its construction stone portfolio, the company supplies decorative natural stones, including red and brown sandstone, pink granite, river-washed pebbles, and brown flagstone. These are distributed to retail garden centers and landscape suppliers.
  • Lafarge Canada: One of Canada's major construction materials providers, offering products such as cement, ready-mix concrete, aggregates, and paving materials. Within its aggregates division, Lafarge supplies dolomitic sandstone from quarries in Brockville, Hawthorne, and South Gloucester. This sandstone is certified for public infrastructure projects, meeting regulatory standards for use in road construction, concrete bedding, and other civil applications.

Key Players

  • Antolini
  • Graymont
  • Kangli Stone Group
  • Lafarge Canada
  • Levantina
  • Mumal Marbles
  • Stonemart
  • Vetter Stone
  • Xiamen Wanli Stone Stock
  • Xishi Group

Explore Horizon Databook – The world's most expansive market intelligence platform developed by Grand View Research.

Conclusion

The global sandstone market is poised for steady growth through 2033, driven by the material’s aesthetic appeal, affordability, and eco-friendly characteristics. With increasing urbanization, particularly in the Asia Pacific and Middle East & Africa regions, sandstone continues to be a preferred material in both traditional and modern construction. Its rising use in sustainable building projects, especially across Europe, highlights a broader industry shift toward natural and locally sourced materials. As construction and infrastructure demands grow, sandstone’s role as a durable, versatile, and environmentally conscious building solution will continue to expand globally.

Robotic Sensors Market: The Rise of Vision Sensors in Smart Automation

Global Robotic Sensors Market Overview

The global robotic sensors market was valued at USD 1,819.4 million in 2024 and is anticipated to reach USD 3,625.8 million by 2033, expanding at a CAGR of 8.1% from 2025 to 2033. This robust growth is fueled by the accelerating adoption of automation across various industries and the increasing deployment of autonomous mobile robots (AMRs) and collaborative robots (cobots) in applications such as logistics, inspection, precision manufacturing, and safety monitoring.

Robotic sensors market size and growth forecast (2023-2033)

The market is witnessing substantial momentum as industries embrace automation to enhance efficiency, accuracy, and productivity. The advancement of sensor technologies—such as LiDAR, ultrasonic, and tactile sensors—has made them more compact, capable, and cost-efficient, further driving adoption. A growing emphasis on workplace safety and high-precision operations across sectors is also contributing significantly to market expansion.

A major trend reshaping the robotic sensors market is the integration of Artificial Intelligence (AI) into robotic systems. AI-powered algorithms are enabling sensors to interpret complex data, recognize patterns, and make autonomous, real-time decisions. This fusion is particularly impactful in areas like autonomous vehicles, drones, and smart robotics, allowing robots to adapt to dynamic environments with enhanced intelligence and operational flexibility.

Order a free sample PDF of the Robotic Sensors Market Intelligence Study, published by Grand View Research.

Key Market Trends & Insights

  • Regional Insights: In 2024, Asia Pacific emerged as the largest market, accounting for over 50% of the global share. This dominance is attributed to rapid industrial automation and expanding manufacturing capabilities in nations such as China, Japan, South Korea, and India. Robotic sensors in this region are widely used in assembly, inspection, and logistics, particularly in the automotive and electronics industries.
  • Sensor Type: Force/torque sensors held the largest market share at 25.7% in 2024. These sensors are critical for measuring applied force, load, or pressure in tasks like assembly, polishing, and inspection. They are essential for both industrial and collaborative robots where precise feedback and control are required.
  • Application: The object detection and recognition segment accounted for over 20.7% of the market in 2024. These sensors enable robots to detect and identify tools, parts, and objects during operation, supporting tasks such as sorting, packaging, and pick-and-place in logistics and manufacturing settings.
  • Robot Type: Industrial robots represented a significant share of the market in 2024, with widespread use in manufacturing processes such as painting, welding, and assembly. Sensors—particularly force and vision types—are integral to monitoring movement, ensuring accuracy, and preventing operational errors.

Market Size & Forecast

  • 2024 Market Size: USD 1,819.4 Million
  • 2033 Projected Market Size: USD 3,625.8 Million
  • CAGR (2025-2033): 8.1%
  • Asia Pacific: Largest market in 2024

Key Companies & Market Share Insights

  • SICK AG: Offers a broad sensor portfolio including 2D/3D vision sensors, LiDAR, encoders, and proximity sensors. SICK’s technologies support mobile robots, AGVs, and robotic arms in navigation, safety, and process control, with new investments in AI-driven mapping and localization.
  • Orbbec 3D Technology International, Inc.: Specializes in 3D vision systems, including structured light, stereo vision, and time-of-flight sensors. Orbbec’s innovations power AMRs, cobots, and automation systems, with recent advancements in Ethernet compatibility and AI-based imaging for logistics and healthcare robotics.
  • Keyence Corporation: Produces sensors for inspection, quality control, and robotic positioning. Key products include laser displacement sensors, 3D scanners, and optical profilers. Its solutions are heavily used in assembly lines and bin-picking operations across electronics, automotive, and pharma industries.
  • Omron Corporation: Provides proximity sensors, vision systems, and laser displacement tools tailored for automation and real-time feedback in robotics. Omron is known for integrated sensing platforms that enable safety zones and predictive maintenance in collaborative robot applications.
  • Basler AG: A key manufacturer of industrial cameras and embedded vision modules. Basler’s offerings support robotic inspection, guidance, and object recognition, with usage spanning industries like food processing, logistics, and electronics manufacturing.
  • Mann + Hummel: An emerging participant in the robotic sensors field, contributing with filtration-integrated sensing solutions aimed at enhancing equipment longevity and operational safety.

Key Players

  • ATI Industrial Automation, Inc.
  • Baumer Group
  • FANUC CORPORATION
  • Futek Advanced Sensor Technology, Inc.
  • Honeywell International Inc.
  • Infineon Technologies
  • Omron Corporation
  • Sensata Technologies, Inc.
  • TE Connectivity Ltd.
  • Tekscan, Inc.
  • SICK AG
  • Orbbec 3D Technology International, Inc.

Explore Horizon Databook – The world's most expansive market intelligence platform developed by Grand View Research.

Conclusion

The global robotic sensors market is on a strong growth trajectory, driven by rising automation, technological advances in sensor design, and AI integration. With industrial sectors continually seeking higher efficiency and safety, and with regions like Asia Pacific leading in automation investments, robotic sensors are becoming an essential component of next-generation robotics. As applications diversify across manufacturing, logistics, healthcare, and beyond, sensor technologies will play a pivotal role in enabling smarter, safer, and more adaptive robotic systems.

Tuesday, July 29, 2025

Home Decor Market Furniture Dominance: Why Wood Rules the Roost

Global Home Decor Market Overview

The global home decor market was valued at USD 960.14 billion in 2024 and is projected to reach USD 1,622.90 billion by 2030, growing at a CAGR of 9.4% from 2025 to 2030. The industry's growth is primarily fueled by the increasing use of sustainable materials, evolving interior design trends, and rapid urbanization.

Consumers are showing a strong preference for eco-friendly materials such as bamboo for furniture and flooring and organic fabrics for soft furnishings. In addition, the rising popularity of multipurpose and foldable furniture caters to the demand for sustainability and space optimization, particularly in urban areas. These products not only reduce environmental impact but also enhance visual appeal.

Home Decor Market Size by Product, 2020 - 2030 (USD Billion)

Influence of Social Media and Urban Lifestyle

The widespread accessibility of home decor content through social media platforms is also playing a critical role in encouraging frequent interior redesigns. This trend is particularly prominent among first-time homeowners, who are enthusiastic about investing in both the interiors and exteriors of their living spaces.

Urban migration continues to expand as more individuals relocate to cities for better opportunities. In turn, consumers are increasingly motivated to decorate their living environments according to personal preferences. The demand for furniture, textiles, artificial flooring, and decorative elements has seen significant growth. According to a 2024 Opendoor report, U.S. consumers, on average, spend USD 5,635 on renovation projects and USD 1,598 on home decor, highlighting strong consumer interest in home improvement.

Order a free sample PDF of the Home Decor Market Intelligence Study, published by Grand View Research.

Key Market Trends & Insights

  • North America led the global home decor market in 2024 with a 36.7% revenue share. High disposable incomes, a broad selection of products, and fast-changing design preferences support the region’s dominance.
  • The furniture segment accounted for the largest product share at 50.7% in 2024. Urban living conditions and demand for compact, stylish, and space-saving furniture continue to drive this segment's growth.
  • In terms of application, the indoor segment held the largest revenue share in 2024. Increasing investment in home interiors such as bedrooms, living rooms, bathrooms, and kitchens is being propelled by social media influence and the availability of innovative decor options online.

Market Size & Forecast

  • 2024 Market Size: USD 960.14 Billion
  • 2030 Projected Market Size: USD 1,622.90 Billion
  • CAGR (2025-2030): 9.4%
  • Leading Region (2024): North America
  • Fastest Growing Region: Asia Pacific

Key Companies & Market Share Insights

Several major players are actively shaping the global home decor market:

  • Inter IKEA Systems B.V. (IKEA) – A global leader in functional and affordable home furniture. Known for its wide product range, including living, dining, and bedroom furnishings, textiles, lighting, and outdoor solutions. IKEA’s signature flat-pack model continues to appeal to cost-conscious and space-constrained urban consumers.
  • MillerKnoll, Inc. (Herman Miller) – A prominent U.S.-based provider of both office and home furnishings. The company focuses on sustainability, offering seating, tables, storage, and decorative items while emphasizing responsible manufacturing practices.

Other key companies include Kimball International Inc., Hanssem Corporation, home24, Conair Corporation, Suofeiya Home Collection Co., Ltd., Koninklijke Philips N.V., Springs Window Fashions LLC, and Siemens AG. These companies are increasingly embracing trends such as personalized decor and sustainable product offerings, and many are collaborating with celebrities and influencers to enhance brand reach.

Key Players

  • IKEA Systems B.V.
  • Kimball International Inc.
  • Herman Miller, Inc.
  • home24
  • Hanssem Corporation
  • Koninklijke Philips N.V.
  • Conair Corporation
  • Suofeiya Home Collection Co., Ltd.
  • Springs Window Fashions LLC
  • Siemens AG

Explore Horizon Databook – The world's most expansive market intelligence platform developed by Grand View Research.

Conclusion

The global home decor market is poised for robust growth through 2030, driven by sustainable living trends, social media influence, and the rise of urban lifestyles. As consumers prioritize eco-friendly materials and functional design, manufacturers are innovating to meet these demands. With North America maintaining its leadership position and Asia Pacific emerging as the fastest-growing region, the market is set to benefit from expanding consumer bases, evolving tastes, and higher spending on home improvement. Companies that continue to integrate sustainability, personalization, and digital engagement into their strategies will be best positioned to capitalize on this dynamic and rapidly evolving industry.

Yacht Market Super Yacht Supremacy: Why This Segment Rules

Global Yacht Market Overview

The global yacht market was valued at USD 9.39 billion in 2023 and is projected to reach USD 13.29 billion by 2030, expanding at a compound annual growth rate (CAGR) of 5.1% from 2024 to 2030. This consistent growth is fueled by increasing disposable incomes and a rising global appetite for luxury and leisure experiences.

One of the key drivers of market expansion is the demand from high-net-worth individuals (HNWIs), who seek premium, customized travel experiences. This trend is being reinforced by the broader growth of the luxury tourism sector. In response, yacht manufacturers are integrating advanced features that improve both performance and the onboard experience.

Yacht Market Trends, by Region, 2024 - 2030

Technological Advancements and Material Shifts

Yacht construction has evolved significantly from traditional materials such as wood and fiber-reinforced polymers (FRPs) to modern composite materials, which offer enhanced strength, lower maintenance, and superior corrosion resistance. Additionally, electronically controlled fuel injection systems are increasingly adopted, improving engine efficiency, reducing emissions, and minimizing noise and vibration—especially in environmentally sensitive coastal and port areas.

Affordability and Access

Despite the high cost of ownership, the growing availability of yacht rentals has helped mitigate barriers, expanding access to marine tourism and recreational boating. Furthermore, developments in maritime security, tracking, connectivity, telematics, and IoT integration are expected to further unlock market potential.

Order a free sample PDF of the Yacht Market Intelligence Study, published by Grand View Research.

Key Market Trends & Insights

  • Europe held the largest revenue share (38.9%) in 2023, driven by its large concentration of HNWIs, strong yachting culture, and thriving marine tourism industry.
  • The super yacht segment accounted for over 31% of global revenue in 2023. Their immense popularity among the ultra-wealthy stems from the unmatched luxury, space, and customization these vessels offer.
  • Yachts measuring 20 to 50 meters dominated the market with a 56.9% share in 2023 and are projected to grow at a CAGR of 5.5%, supported by lower operating costs, better sailing efficiency, and affordable moorage.
  • Motor yachts represented the most popular propulsion type in 2023, comprising 81.5% of revenue, and are expected to grow at 5.3% CAGR through 2030 due to their power, speed, and versatility in long-distance cruising.

Market Size & Forecast

  • 2023 Market Size: USD 9.39 Billion
  • 2030 Projected Market Size: USD 13.29 Billion
  • CAGR (2024-2030): 5.1%
  • Leading Region (2023): Europe
  • Fastest Growing Region: Asia Pacific

Key Companies & Market Share Insights

Several major companies are shaping the global yacht market:

  • Ferretti S.p.A (Italy) – Specializes in luxury composite yachts and custom superyachts under brands such as Riva and Pershing. Operates across six Italian shipyards, emphasizing quality, innovation, and Italian craftsmanship.
  • Damen Shipyards Group (Netherlands) – A major shipbuilder producing a wide range of vessels including naval and workboats. Known for standardized, modular construction with efficient production capabilities.
  • Azimut Benetti Group (Italy) – A global leader in motor and mega yachts, with six shipyards and a strong focus on innovation, sustainability, and expanded production capacity.

Emerging Players:

  • Feadship – Renowned for technological leadership and exclusivity, including hydrogen fuel-cell innovations and fully custom superyachts tailored for ultra-high-net-worth individuals.
  • Heesen Group – Known for fast, high-performance aluminum superyachts, offering a blend of customization and production efficiency with fuel-conscious design.

Key Players

  • Alexander Marine International (AMI) Co., Ltd.
  • Azimut Benetti Group
  • Damen Shipyards Group
  • Feadship
  • Ferretti SpA
  • Flensburger Schiffbau Gesellschaft GmbH (FSG)
  • Heesen Group
  • Princess Yachts Limited
  • Sanlorenzo SpA
  • Sunseeker International
  • Viking Yacht Company
  • WANDA Group

Explore Horizon Databook – The world's most expansive market intelligence platform developed by Grand View Research.

Conclusion

The global yacht market is on a steady growth trajectory, driven by increasing wealth, evolving consumer preferences, and significant technological innovation. While Europe currently dominates the market, rapid expansion is expected in Asia Pacific due to growing affluence and emerging marine tourism hubs. The shift toward sustainable materials, efficient propulsion systems, and advanced onboard technologies is transforming yacht design and usage. As the industry embraces rental models and connectivity solutions, it is becoming more accessible and efficient, paving the way for broader adoption and sustained growth in the years ahead.

Botulinum Toxin Market Type A vs B: What’s Fueling the Surge?

Global Botulinum Toxin Market Overview

The global botulinum toxin market was valued at USD 11.1 billion in 2023 and is projected to reach USD 21.1 billion by 2030, expanding at a compound annual growth rate (CAGR) of 9.8% from 2024 to 2030. Botulinum toxin is a protein-based neurotoxin derived from the bacterium Clostridium botulinum. It works by selectively inhibiting the release of acetylcholine from nerve endings, effectively blocking neural transmission when injected into muscle tissue.

Global Botulinum Toxin Market share and size, 2023

Botulinum toxin has become one of the most significant innovations in modern medicine and cosmetology. Its adoption has grown rapidly over the past decade, making it one of the most widely performed aesthetic treatments globally. Increasing concern with personal appearance in both developed and emerging economies is driving a surge in cosmetic procedures.

Market growth is supported by the availability of various commercial formulations, including Botox, Xeomin, Dysport, and others. These products are frequently used in aesthetic applications such as the treatment of glabellar lines, forehead lines, and chemical browlifts. While multiple Type-A products are widely available, Myobloc remains the only Type-B product currently on the market.

Order a free sample PDF of the Botulinum Toxin Market Intelligence Study, published by Grand View Research.

Key Market Trends & Insights

  • North America led the global market in 2023, accounting for a 46.9% revenue share, and is expected to reach USD 5.1 billion by 2030. Growth in this region is driven by higher disposable income and an increasing number of cosmetic procedures. For instance, the American Society of Plastic Surgeons (ASPS) reported 1.3 million botulinum toxin procedures in 2019 alone.
  • By end-use, cosmetic centers and medspas held the largest share at 44.5% in 2023 and are projected to grow at a CAGR of 10.2%. The rising popularity of aesthetic treatments in dermatology clinics and medspas, coupled with increased consumer interest, supports the expansion of this segment.
  • Based on product type, botulinum toxin Type-A dominated the market with a 98.8% share in 2023. This segment is expected to continue expanding due to its advantages such as minimal pain, absence of bleeding, and no visible scarring. Additionally, Botulinum toxin Type-A is increasingly used in the treatment of chronic migraines, tension-type headaches, and various neurological disorders.
  • The aesthetic application segment is projected to grow at a CAGR of 10.2% during the forecast period. Rising awareness of cosmetic appearance and rapid technological advancements in both developed and developing markets are contributing to a surge in aesthetic procedures.

Market Size & Forecast

  • 2023 Market Size: USD 11.1 Billion
  • 2030 Projected Market Size: USD 21.1 Billion
  • CAGR (2024-2030): 9.8%
  • Leading Region (2023): North America
  • Fastest Growing Region: Asia Pacific

Key Companies & Market Share Insights

The botulinum toxin market is highly competitive and heavily regulated. Leading industry players continue to focus on strategies such as product innovation, strategic alliances, joint ventures, and advanced service offerings to strengthen their market positions.

A notable example is a July 2020 collaboration between Tenjin Pharma and Merz Pharma, which involved the sale of Xeomin (incobotulinumtoxinA) by Tenjin Pharma in 50, 100, and 200 unit doses. This product was approved by Japan’s Ministry of Health for treating lower limb spasticity. The partnership allowed both companies to broaden their product portfolios and enhance revenue streams through targeted therapeutics.

Key Players

  • Ipsen Group
  • Allergen, Inc.
  • Metabiologics
  • Merz Pharma
  • US Worldmeds
  • Evolus
  • Galderma
  • Lanzhou Institute of Biological Products

Explore Horizon Databook – The world's most expansive market intelligence platform developed by Grand View Research.

Conclusion

The global botulinum toxin market is poised for substantial growth through 2030, driven by increasing cosmetic awareness, expanding medical applications, and rising disposable incomes. North America currently dominates the market, while Asia Pacific is expected to experience the fastest growth. Key players are capitalizing on rising demand by introducing innovative products and expanding into new therapeutic areas. As technological advancements and aesthetic preferences continue to evolve, the demand for botulinum toxin-based treatments—both cosmetic and therapeutic—is likely to see sustained momentum in the coming years.

Friday, July 25, 2025

Remittance Market Trends: How Digital Solutions are Reshaping Cross-Border Transfers

The global remittance market was valued at approximately USD 48.99 billion in 2021 and is projected to reach USD 107.80 billion by 2030, growing at a compound annual growth rate (CAGR) of 10.1% from 2022 to 2030. Cross-border remittances provide significant economic benefits, including enhanced financial inclusion and economic development. For migrants and their families, remittances represent a crucial source of income, typically spent on essential needs such as medications, education, food, and housing.

Global remittance market share, by end-use, 2021 (%)

Traditionally, sending money abroad has been a time-consuming and costly process, characterized by numerous intermediaries, hidden fees, and extensive paperwork. However, recent advancements in the industry have allowed individuals and small-to-medium-sized businesses to access cheaper, faster, and more efficient foreign fund transfer services. Historically, large corporations, banks, and governments have benefited from direct access to the institutional foreign exchange market, which has fueled growth in the remittance sector.

Moreover, new entrants into the remittance market are intensifying competition, leveraging fees as a key differentiator to attract customers and enhance convenience and affordability. Established players are capitalizing on the capabilities of digital platforms and benefiting from lower fixed costs. Their modern technological and operational infrastructures enable faster turnaround times and lower fees, making remittances accessible to a wider audience. Additionally, many market participants are forming partnerships with innovative fintech companies to broaden their regional reach.

Order a free sample PDF of the Remittance Market Intelligence Study, published by Grand View Research.

Key Market Trends & Insights

  • North America led the remittance market in 2021, accounting for over 24.0% of the revenue share. This dominance is due to the presence of prominent players such as Bank of America Corporation and Citigroup, Inc. Additionally, fintech companies in North America are actively collaborating with major players to leverage their strengths.
  • By mode of transfer, the traditional (non-digital) segment held the largest revenue share of over 75.0% in 2021. Traditional remittance methods, which include cheques and ATMs, are preferred by consumers for their perceived security and safety. Prior to the rise of digital channels, these methods were the only available options for international remittances, justifying their significant market share.
  • In terms of type, the outward remittance segment dominated the market in 2021, accounting for over 54.0% of the revenue share. Outward remittances facilitate global transactions, allowing businesses to capitalize on opportunities that may not be available otherwise.
  • By channel, the money transfer operators segment represented the largest revenue share of over 50.0% in 2021. While bank fees vary based on destination and specific bank policies, many money transfer operators offer flat rates, making international transfers more affordable.
  • In terms of end-use, the personal remittance segment accounted for more than 42.0% of the global revenue share in 2021. Personal remittances encompass all financial transactions between resident and non-resident parties, including both migrants and non-migrants.

Market Size & Forecast

  • 2021 Market Size: USD 48.99 Billion
  • 2030 Projected Market Size: USD 107.80 Billion
  • CAGR (2022-2030): 10.1%
  • North America: Largest market in 2021
  • Asia Pacific: Fastest growing market

Key Companies & Market Share Insights

Prominent players in the remittance market are employing various strategies, including research and development initiatives, product innovations, joint ventures, strategic partnerships, expansions, and mergers & acquisitions to gain a competitive edge. Many companies are leveraging the capabilities of newly emerged fintech firms to provide customers with convenient remittance solutions. For instance, in August 2022, Currencycloud collaborated with Future FinTech (FTFT) Labs to launch the remittance application, Tempo, for U.S. immigrants. This partnership enables FTFT Labs to offer customers a multi-currency wallet with competitive fees.

Additionally, vendors are focusing on expanding their presence in the remittance market. For example, in December 2022, Mastercard partnered with Credit Libanais, a Lebanese bank, to facilitate inward cross-border payments via direct bank deposits. This collaboration aims to enhance international payment processes for the bank's customers. Such initiatives and partnerships among key market players are driving the growth of the remittance market.

Key Players

  • Bank of America Corporation
  • ZEPZ
  • Citigroup, Inc.
  • Ria Financial Services, Inc.
  • OFX
  • Wells Fargo
  • Western Union Holdings, Inc.
  • PayPal
  • MoneyGram International, Inc.
  • Wise US, Inc.

Explore Horizon Databook – The world's most expansive market intelligence platform developed by Grand View Research.

Conclusion

The remittance market is poised for significant growth, driven by the increasing demand for cross-border financial services and the ongoing advancements in technology that enhance the efficiency and affordability of money transfers. As competition intensifies and new players enter the market, consumers will benefit from improved services and lower fees. With a strong emphasis on financial inclusion and the economic importance of remittances for migrant households, the market is well-positioned for continued expansion in the coming years. As regions like Asia Pacific experience rapid growth, the overall landscape of the remittance market will evolve, offering new opportunities for innovation and collaboration.

Smart Elevator Market Trends: How Technology is Shaping Vertical Transportation

 Smart Elevator Market Overview

In 2023, the global smart elevator market was valued at USD 10.8 billion, and it is forecasted to reach USD 17.34 billion by 2030, growing at a compound annual growth rate (CAGR) of 7.2% from 2024 to 2030. One of the primary drivers for this shift from conventional to smart elevators is the increasing awareness around energy efficiency.

The adoption of gearless permanent magnet synchronous (PMS) traction machines is on the rise due to their efficiency, which is nearly 50% better compared to geared machines. Additionally, smart elevators often incorporate regenerative drive systems that not only significantly cut down on energy consumption but can also produce energy that feeds back into the building’s power grid.

Smart Elevator Market Size by Component, 2020 - 2030 (USD Billion)

Market growth is fueled by several factors, including the rising demand for automation, energy efficiency, and advanced safety systems. Integration of technologies like the Internet of Things (IoT) and artificial intelligence (AI) has enhanced automation, improved operational efficiency, shortened wait times, and optimized performance during peak usage hours. The growing push for sustainable building practices is also accelerating the transition toward smart, energy-efficient elevator systems capable of reducing energy usage by up to 50%.

Order a free sample PDF of the Smart Elevator Market Intelligence Study, published by Grand View Research.

Key Market Trends & Insights

  • Asia Pacific held the largest share of the global smart elevator market in 2023, accounting for 43.3% of total revenue. This dominance is attributed to rapid urbanization, increasing population, and large-scale infrastructure development in countries like China, India, and Japan. These factors have led to increased demand for high-rise buildings and consequently, smart elevator systems.
  • In terms of components, communication systems led the market in 2023 with a 36.7% revenue share. The implementation of IoT has significantly improved real-time monitoring, data acquisition, and predictive maintenance, all of which enhance elevator reliability and safety. These systems also play a vital role in threat detection and emergency response.
  • By application, the commercial sector dominated the market, representing 47.2% of revenue in 2023. This segment includes office buildings, malls, hotels, and other large properties. Smart elevators in these environments utilize features such as destination control systems, occupancy sensors, and energy-efficient components to optimize traffic flow and support sustainability goals, providing both operational efficiency and cost savings.

Market Size & Forecast

  • 2023 Market Size: USD 10.8 Billion
  • 2030 Projected Market Size: USD 17.34 Billion
  • CAGR (2024-2030): 7.2%
  • Largest Regional Market: Asia Pacific (43.3% share in 2023)

Key Companies & Market Share Insights

Key companies are leveraging IoT and AI technologies to enhance elevator performance and user experience. Through continuous innovation, strategic partnerships, and expansion of service offerings, they are driving advancements across the industry. New entrants are also contributing by offering specialized, innovative solutions that add to market competitiveness.

Notable company profiles:

  • Robert Bosch GmbH is known for its strong innovation focus and operates across mobility, industrial technology, consumer goods, and energy and building technology sectors.
  • PHINIA Inc. brings over a century of manufacturing experience, offering premium fuel system solutions and focusing on carbon neutrality through alternative fuel technologies.

Key Players

  • Bosch Security Systems, LLC.
  • FUJITEC CO., LTD.
  • Hitachi, Ltd.
  • HYUNDAIELEVATOR CO.,LTD.
  • KONE Corporation Finland
  • Mitsubishi Electric Corporation
  • Otis Worldwide Corporation
  • Schneider Electric
  • TK Elevator
  • Schindler
  • Toshiba Elevator and Building Systems Corporation
  • Honeywell International Inc.
  • Siemens

Explore Horizon Databook – The world's most expansive market intelligence platform developed by Grand View Research.

Conclusion

The global smart elevator market is undergoing significant transformation, driven by the growing need for energy efficiency, automation, and improved safety in modern infrastructure. With a projected market value of USD 17.34 billion by 2030, the industry is set to benefit from advancements in IoT and AI technologies, along with increasing investments in sustainable construction. Asia Pacific is expected to continue leading the market, supported by rapid urban development and population growth. The evolution of elevator technology will remain a key component in shaping the future of smart buildings and sustainable urban mobility.

Agro Textile Market Growth: Key Trends Shaping the Future of Agricultural Fabrics

The global agro textile market was valued at approximately USD 4.62 billion in 2021 and is projected to reach USD 6.98 billion by 2030, growing at a compound annual growth rate (CAGR) of 4.7% from 2022 to 2030. The increasing need to enhance agro productivity to meet the daily demands of a growing population, along with rising product demand for improving crop quality and overall productivity, is expected to drive industry growth during the forecast period.

The COVID-19 pandemic presented various challenges related to plant management, logistics, and supply chains in some countries within the OPEC region. However, favorable government policies promoting sustainable practices in agriculture and related sectors are anticipated to boost product demand in the coming years.

Global agro textile market share, by end-use, 2021 (%)

Agro textiles have multiple applications, including boosting germination in nurseries, protecting soil from moisture evaporation and erosion, and safeguarding against environmental and climatic factors such as hail, rain, and sunlight. They provide protection from birds, insects, fungus, and other pests, which has contributed to increased product adoption in the U.S. Woven agro textiles, produced on weaving machines, resist shrinkage and weathering, making them ideal for moisture-prone environments.

Woven fabrics are thicker and sturdier than other textiles, making them suitable for protective applications such as packaging and ground covers. These products are utilized in various sectors, including forestry, horticulture, aquaculture, landscaping, and animal husbandry, helping to protect livestock and crops during transportation and safeguarding them from animals, insects, fungus, and weeds. Agro textiles are also employed in capturing, shading, and irrigation applications. However, the production of agro textiles is a cost-intensive process due to the high costs of raw materials, such as petroleum, and the advanced manufacturing technologies required to produce yarn from these materials. This high production cost may hinder growth to some extent.

Order a free sample PDF of the Agro Textiles Market Intelligence Study, published by Grand View Research.

Key Market Trends & Insights

  • The Asia Pacific region dominated the global agro textile market in 2021, accounting for over 48.10% of the overall revenue. This high share is attributed to the increasing demand for agro products, driven by a rising population and changing consumer preferences. The presence of developed economies like the U.S. and Canada supports the North American market's diversity. Research and development into sustainable agricultural practices and a growing affinity for organic products are expected to further drive industry growth.
  • By material, the synthetic fiber segment represented over 70.30% of total revenue in 2021. This segment's dominance is due to the high demand for synthetic fibers, which are known for their durability, strength, resilience, and resistance to environmental challenges such as moisture and fungi. Additionally, synthetic fibers are easier to handle and manufacture, often being more cost-effective than natural alternatives.
  • In terms of type, the knitted agro textile segment led the market in 2021, accounting for more than 47.80% of overall revenue. Knitted fabrics are used in various applications, including impact protection through wind control, hail protection, and bird nets. Their versatility and ease of handling have significantly increased product demand.
  • By end use, fishing nets accounted for the largest share in 2021, exceeding 54.00% of overall revenue. The growing use of aquatic life in industries such as nutraceuticals, pharmaceuticals, and cosmetics, combined with rising seafood consumption, has fueled the growth of aquaculture and, consequently, the fishing net segment. Shade nets are selected based on the crops grown beneath them, depending on the light tolerance of each crop.

Market Size & Forecast

  • 2021 Market Size: USD 4.62 Billion
  • 2030 Projected Market Size: USD 6.98 Billion
  • CAGR (2022-2030): 4.7%
  • Asia Pacific: Largest market in 2021

Key Companies & Market Share Insights

Major players in the agro textile market are forming agreements with emerging and small-scale companies to enhance their distribution capabilities and expand market reach. Manufacturers are also focusing on efficient distribution channels to ensure timely access for buyers. Prominent market players have been evaluated based on their geographical reach, distribution networks, product portfolios, innovation, strategic developments, operational capabilities, and brand presence in the market.

Key Players

  • TenCate Industrial Fabrics
  • Garware Technical Fabrics
  • Freudenberg Performance Materials
  • Beaulieu Technical Textiles
  • Belton Industries, Inc.
  • Diatex SAS

Explore Horizon Databook – The world's most expansive market intelligence platform developed by Grand View Research.

Conclusion

The agro textile market is poised for steady growth, driven by the increasing demand for agricultural productivity and sustainable practices. As the global population continues to rise, the need for effective agro textiles that enhance crop quality and protect against environmental factors will remain critical. With significant opportunities in the Asia Pacific region and advancements in synthetic materials, the industry is well-positioned for expansion. As governments promote sustainable agricultural practices, the adoption of agro textiles is expected to rise, further supporting market growth in the coming years.