Chemicals Pricing Intelligence - Executive Summary
Chemicals pricing intelligence covers organic, inorganic, and specialty chemicals. Organic markets were mixed but generally firmer in July 2026, with aromatics and selected downstream intermediates gaining support as renewed Middle East tensions raised crude-linked feedstock costs, tightened regional cargo availability, and encouraged Chinese spot buying; low Chinese benzene stocks and refinery maintenance further constrained prompt supply, although weak downstream margins limited aggressive purchasing. Inorganic markets remained comparatively stable to weak, with cautious demand for caustic soda and soda ash, while sulphuric and nitric acid saw more balanced regional conditions; bromine strengthened in China, whereas carbon black remained influenced by feedstock costs and measured tire and rubber demand. European markets continued to face weak orders, high energy costs, and global overcapacity, while Middle Eastern supply disruptions and ongoing regional chemical investments remained key influences on global trade.
Key Price Developments & Insights
- Aromatics strengthened in July due to tight imports, low Chinese benzene stocks, refinery maintenance, and feedstock concerns.
- IPA and methanol remained sensitive to West Asian supply disruptions, especially in India, which took steps to secure feedstock and ease import restrictions.
- Caustic soda and soda ash stayed subdued due to adequate supply and cautious industrial demand.
- European chemical markets faced high energy costs, weak demand, reduced operating rates, and rising Asian competition.
- Middle Eastern disruptions impacted chemical shipments and feedstock availability, while Saudi Arabia and the UAE continued expanding domestic downstream chemical value chains.
Top Performing Chemicals Commodity
- Top Mover: Benzene
- Average MoM Growth (top 3 geographies): 12.2%
- Volatility Level: High
Schedule a free demo of Grand View Signal to get real-time preview of price fluctuations in the Chemicals Sector
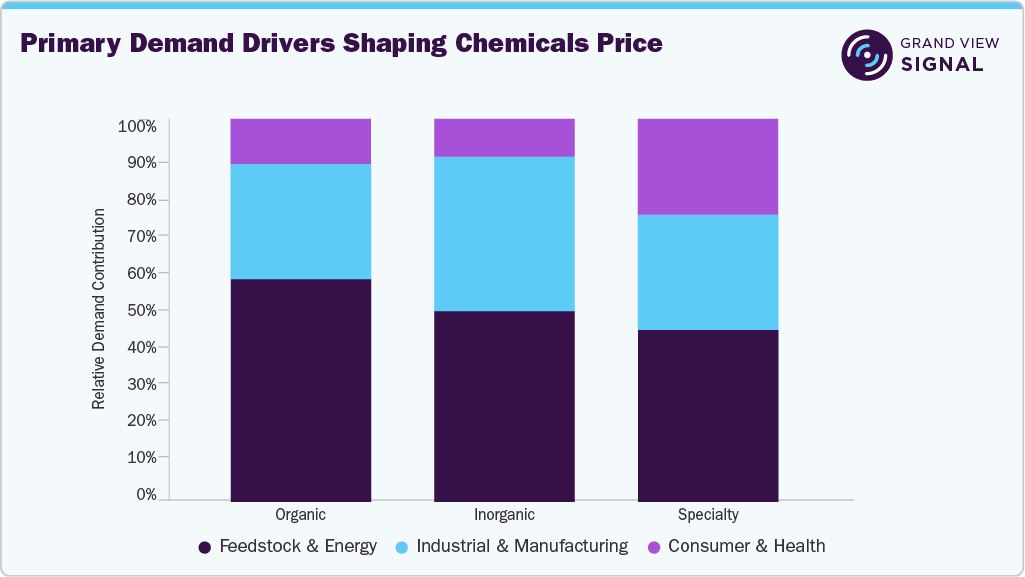
Chemicals Sector Coverage and Key Price Influencers
1. Organic Chemicals
Covers alcohols & glycols, amines, aromatics & olefins, monomers, resin intermediates, organic acids, plasticizers, solvents, ketones, and esters. July pricing was led by aromatics and selected intermediates, while alcohols, acids, and solvents showed mixed movement.
Key Pricing Influencers:
- Crude oil, naphtha, benzene, propylene, and methanol costs
- Plant maintenance, operating rates, and import availability
- Demand from plastics, coatings, textiles, resins, and pharmaceuticals
- Downstream margins and inventory-management decisions
2. Inorganic Chemicals
Covers alkalis & bases, halogens & fluorochemicals, boron & silicon compounds, inorganic salts, mineral acids, and sulphur & carbon products. Pricing remained largely subdued in July, with bromine showing firmer conditions.
Key Pricing Influencers:
- Salt, sulphur, phosphate rock, energy, and mineral costs
- Demand from alumina, glass, fertilizers, mining, and water treatment
- Chlor-alkali operating rates and regional inventory availability
- Sulphur and acid trade flows and shipping conditions
3. Specialty Chemicals
Covers ammonium persulfate, sodium persulfate, and sodium hypochlorite, which showed relatively narrow price movement due to application-specific demand.
Key Pricing Influencers:
- Water-treatment and disinfection requirements
- Polymerization and resin-production activity
- Electronics, textiles, and metal-processing demand
- Electricity and raw material costs
Get historical, current, and forecast chemicals price assessments. Request Free Access to Grand View Signal
Grand View Signal offers
Grand View Signal tracks 200 commodities across multi-countries and reconstructs the price history back to 2016. This way, decision-makers can see not just what a material costs, but the drivers impacting the same. The offering includes commodity price capture across 8 sectors.
- Weekly Commodity Pulse - What changed across commodity markets this week - the panoramic view, in five minutes.
- Why Prices Moved - A single commodity, taken apart. Every driver, ranked, with the causal chain traced.
- Risk Watch - What could disrupt supply in the next four to eight weeks, with exposure graded.
- Decision Brief - The stance, the triggers that would change it, and the six-month forecast.
Explore Grand View Signal and access the full commodity price database and analyst forecasts.
